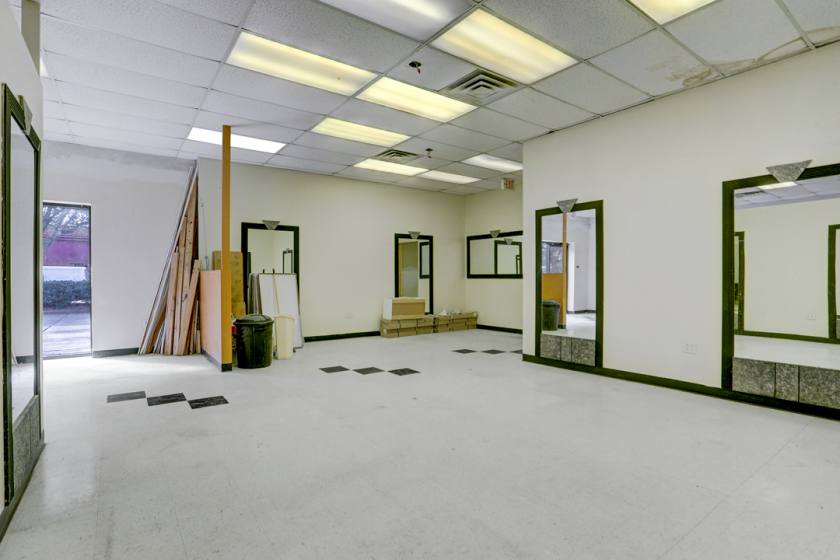
Retail Space
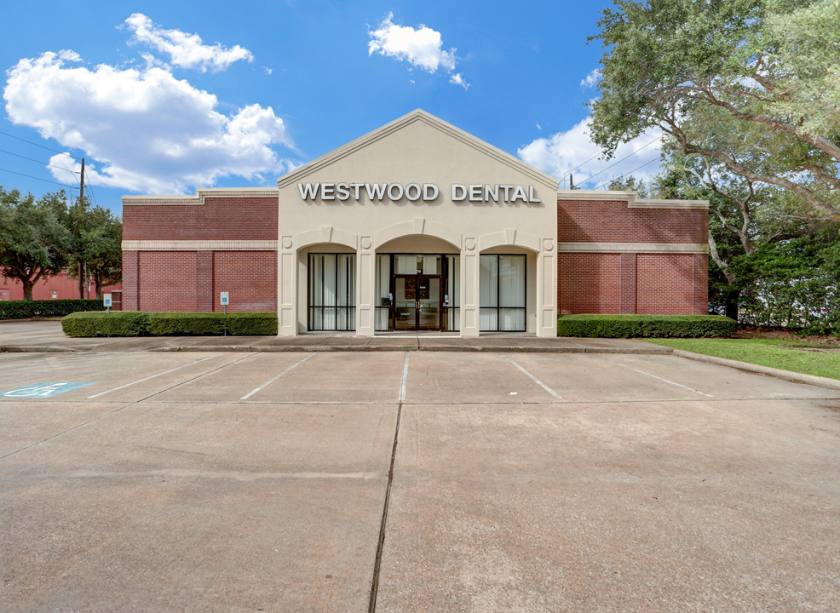
2310 Settlers Way Boulevard Sugar Land, TX 77478
2310 Settlers Way Boulevard Sugar Land, TX 77478
Details & Description
Property Highlights
- • 2nd Generation Hair Salon
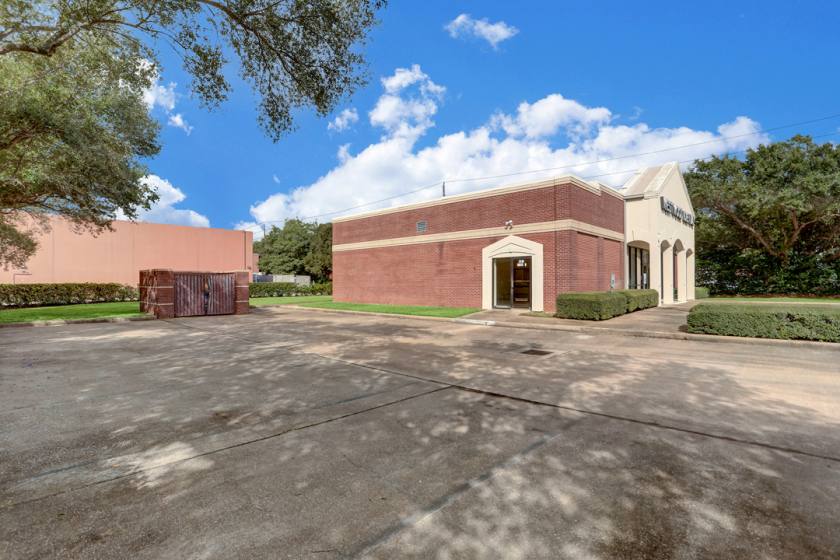
- • 26 Parking Spaces
- • Both Private and Shared Entrances
- • Monument Signage
Additional Photos


Listing Agents

Lisa Rimkus
O: 281-501-1725
lisa@davis-commercial.com
O: 281-501-1725
lisa@davis-commercial.com
While we strive to provide the most accurate information, all listing information, and demographic data, is provided by third-parties. As such, MyEListing will not be responsible for the accuracy of the information. It is strongly recommended that you verify all information with the listing agent, and any relevant agencies, prior to making any decisions.