Lot Size at ±9.4 Acres (Block 14, Lot 9)
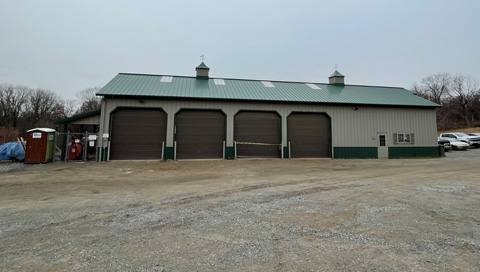
±3,000 SF Warehouse and ±3,440 SF Office
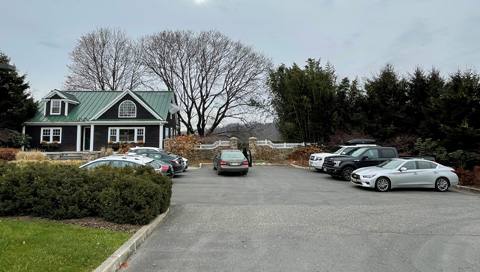
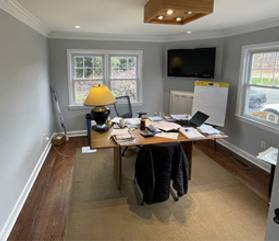
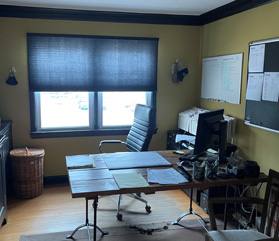
Beautiful Office Building with Walk-Out Lower Floor
Column-Free Warehouse (Perfect for Storage Use)
Great for Landscaper, Contractor, Irrigation Yard, Etc.
Owner Will Consider Paving Site
Approx. 371 Feet of Frontage on Route 22
Zoned Commercial (C2)
Taxes at $17,263.58 (2022)
Approx. 1.5 Miles to I-78 (Direct to Holland Tunnel)
Approx. 61.5 Miles to Philadelphia, PA
Minutes to I-287 and NJ Turnpike
No part of this information may be copied, reproduced, repurposed, or screen-captured for any commercial purpose without prior written authorization from MyEListing.
While we strive to provide the most accurate information, all listing information, and demographic data, is provided by third-parties. As such, MyEListing will not be responsible for the accuracy of the information. It is strongly recommended that you verify all information with the listing agent, and any relevant agencies, prior to making any decisions.
What is the asking price for 1473 U.S. 22 in Clinton Township?
The asking price for 1473 U.S. 22 is $3,950,000
How much land does the Clinton Township, NJ property at 1473 U.S. 22 include?
1473 U.S. 22 in Clinton Township includes 9.400 acres of land
What kind of Land is the propery at 1473 U.S. 22?
The property at 1473 U.S. 22 Clinton Township, NJ 08801 is listed as a Industrial Land Land property
What is the population within 1 mile of 1473 U.S. 22 in Clinton Township?
The population within 1 mile of 1473 U.S. 22 Clinton Township, NJ 08801 is 1,403 people.
Who do I contact for questions about 1473 U.S. 22?
You should contact the listing agent,
Christopher Chiusolo, for any details regarding this commercial listing.