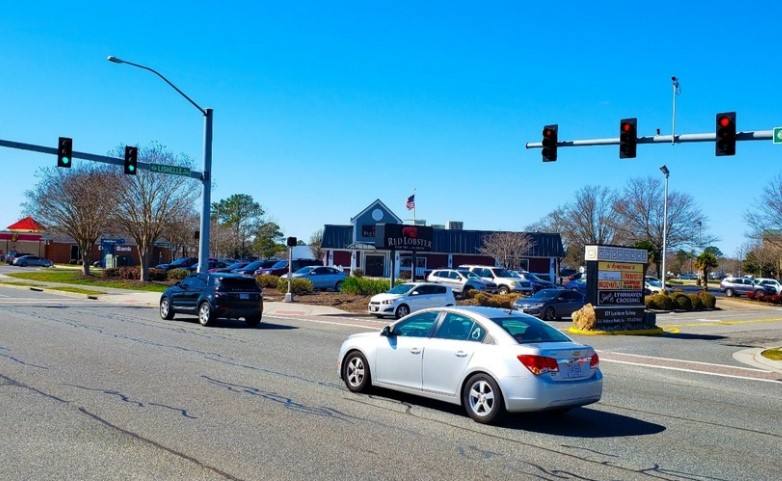
Retail Space
821 Lynnhaven Parkway Virginia Beach, VA 23452
821 Lynnhaven Parkway Virginia Beach, VA 23452

Details & Description
Property Highlights
- • Long term NNN lease (17+ years remaining)
- • 30 year history at this location
- • Corporate guaranty
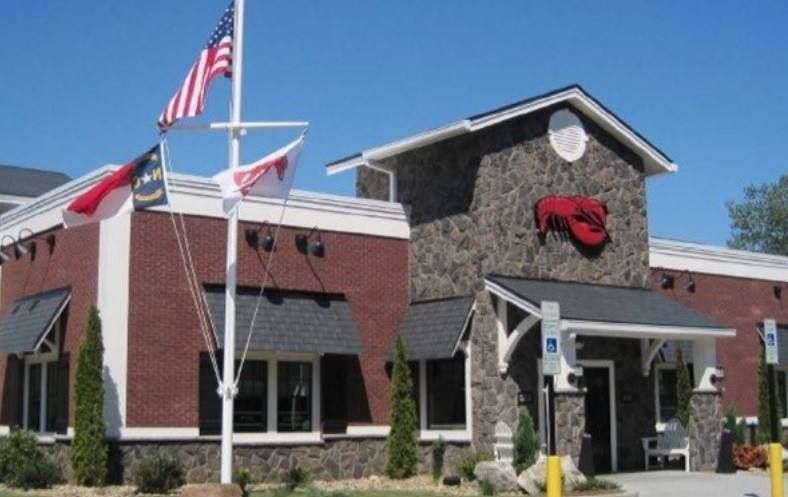
Additional Photos


Listing Agents

Doug Aronson
O: 757-282-6510
M: 757-287-1490
daronson@slnusbaum.com
O: 757-282-6510
M: 757-287-1490
daronson@slnusbaum.com
While we strive to provide the most accurate information, all listing information, and demographic data, is provided by third-parties. As such, MyEListing will not be responsible for the accuracy of the information. It is strongly recommended that you verify all information with the listing agent, and any relevant agencies, prior to making any decisions.


