Industrial Properties
158 Van Wagenen Avenue Jersey City, NJ 07306
158 Van Wagenen Avenue Jersey City, NJ 07306

Details & Description
Property Highlights
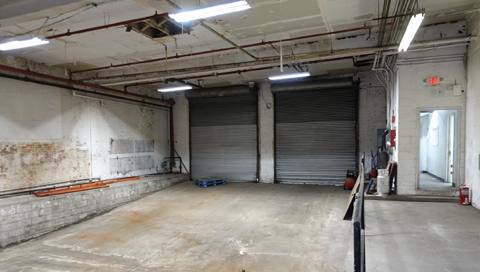
• ±25,000 SF Manufacturing Facility
• ±25,000 SF Manufacturing Facility
Additional Photos


Listing Agents

Jason M. Crimmins
O: 973-379-6644
M: 973-568-6611
jmcrimmins@blauberg.com
O: 973-379-6644
M: 973-568-6611
jmcrimmins@blauberg.com
While we strive to provide the most accurate information, all listing information, and demographic data, is provided by third-parties. As such, MyEListing will not be responsible for the accuracy of the information. It is strongly recommended that you verify all information with the listing agent, and any relevant agencies, prior to making any decisions.


