Industrial Properties
8625 Schumacher Lane Houston, TX 77063
8625 Schumacher Lane Houston, TX 77063

Details & Description
Property Highlights
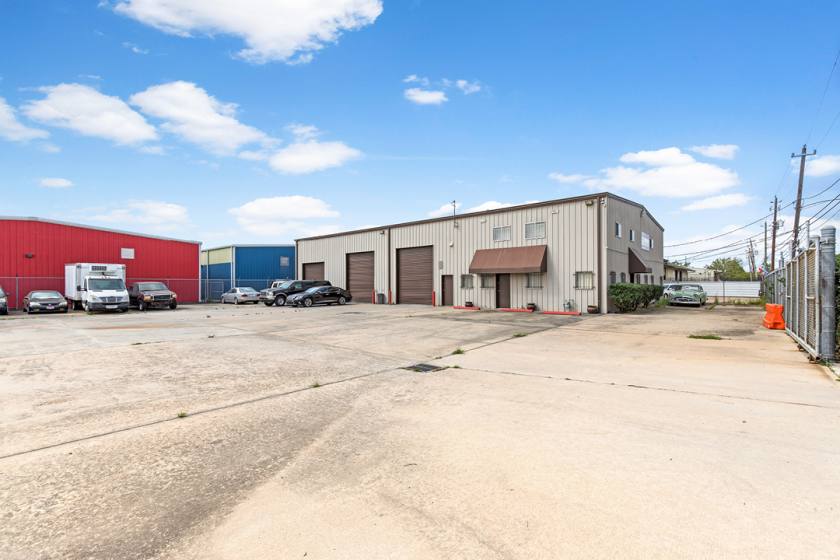
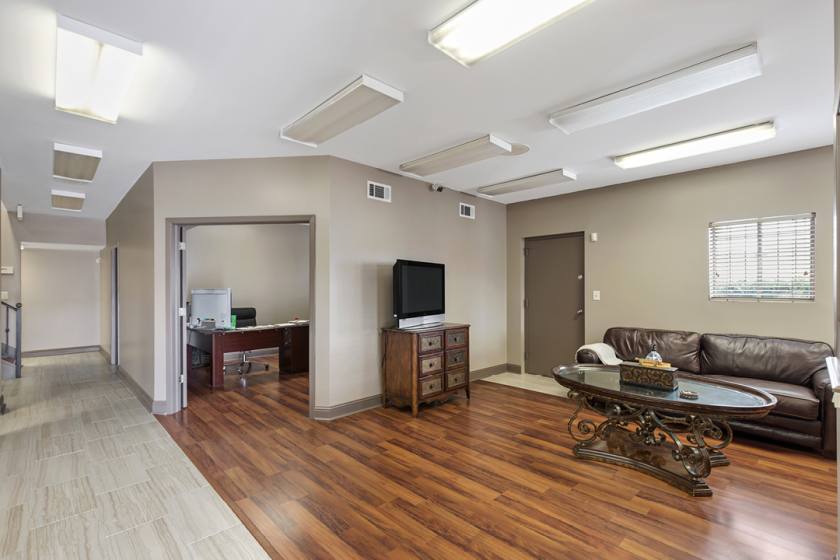
- • Top Notch Office/Warehouse
- • 3,300 SF High End Office Space
- • Extra Large Parking Field
- • 3 Overhead Doors
- • Well Secured/Fenced Lot
Additional Photos


Listing Agents

Cotton Munson
O: 832-804-8041
cotton@davis-commercial.com
O: 832-804-8041
cotton@davis-commercial.com
While we strive to provide the most accurate information, all listing information, and demographic data, is provided by third-parties. As such, MyEListing will not be responsible for the accuracy of the information. It is strongly recommended that you verify all information with the listing agent, and any relevant agencies, prior to making any decisions.


