Commercial Land
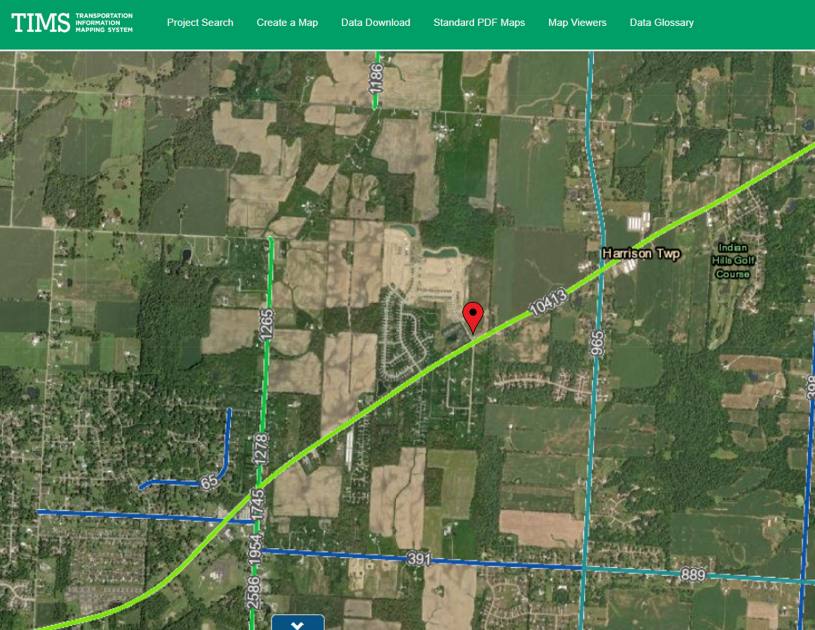
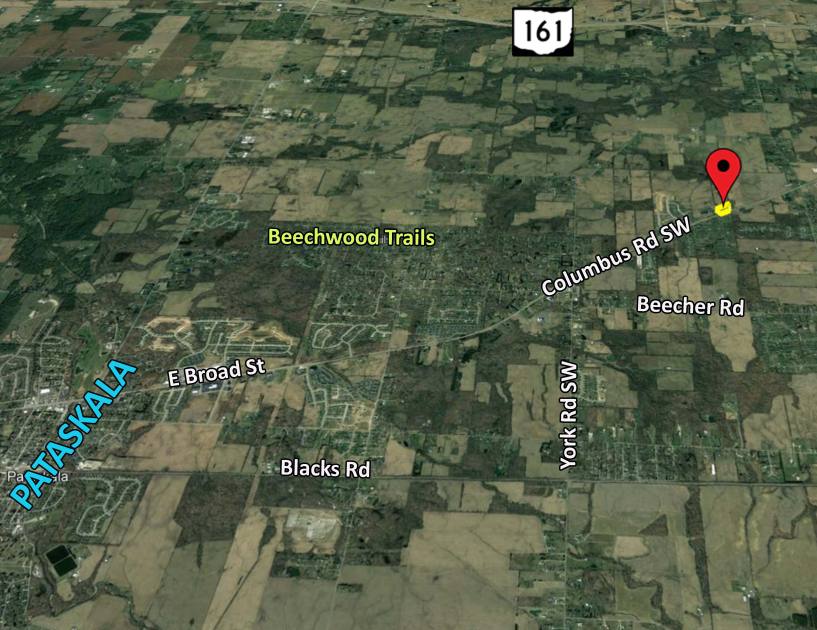
0 Columbus Rd SW Granville, OH 43023
0 Columbus Rd SW Granville, OH 43023

Details & Description
Property Highlights
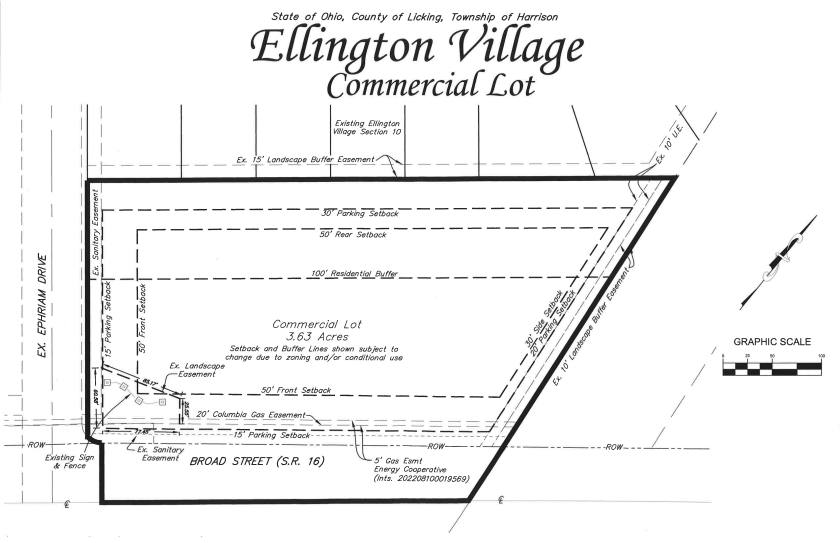
• Excellent visibility on Columbus Rd/SR16/E Broad St
• Zoned B-1 Business District
Additional Photos

Listing Agents

Skip Weiler
O: 614-221-4286
skip@rweiler.com
O: 614-221-4286
skip@rweiler.com
While we strive to provide the most accurate information, all listing information, and demographic data, is provided by third-parties. As such, MyEListing will not be responsible for the accuracy of the information. It is strongly recommended that you verify all information with the listing agent, and any relevant agencies, prior to making any decisions.


