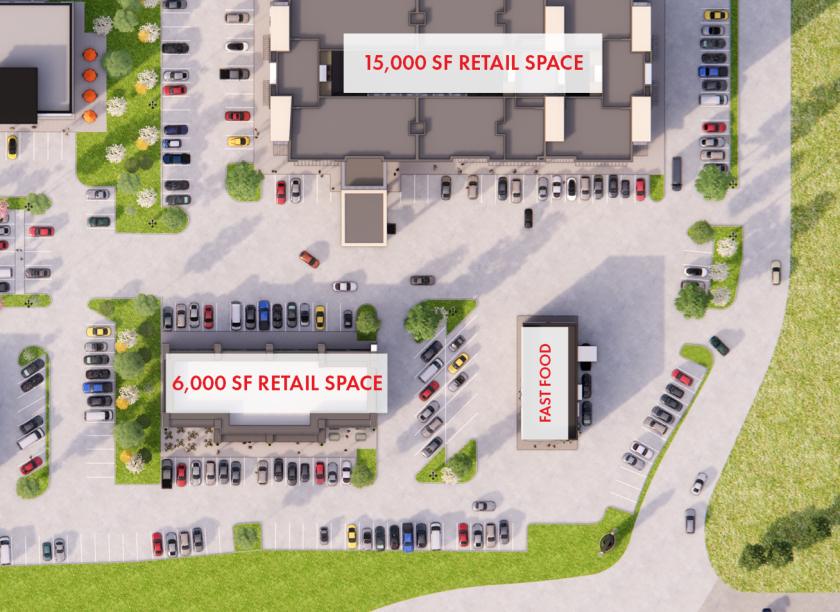
Retail Space
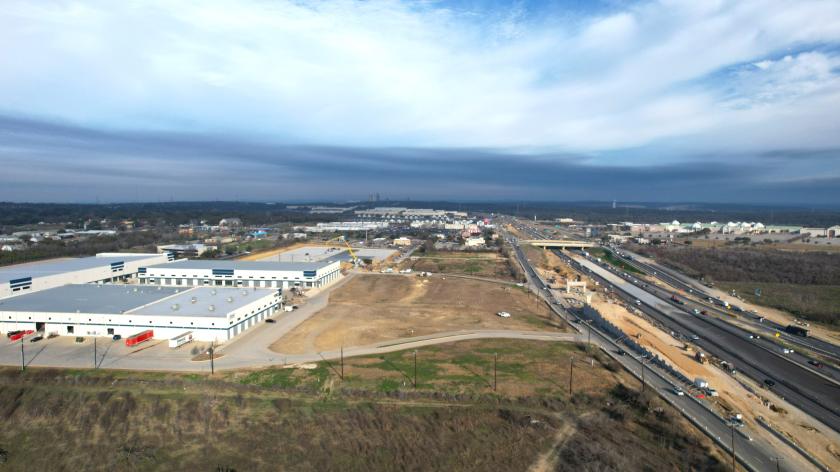
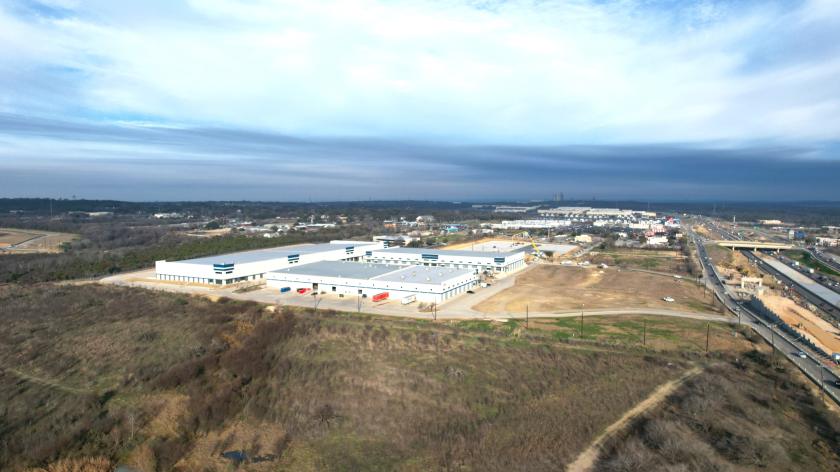
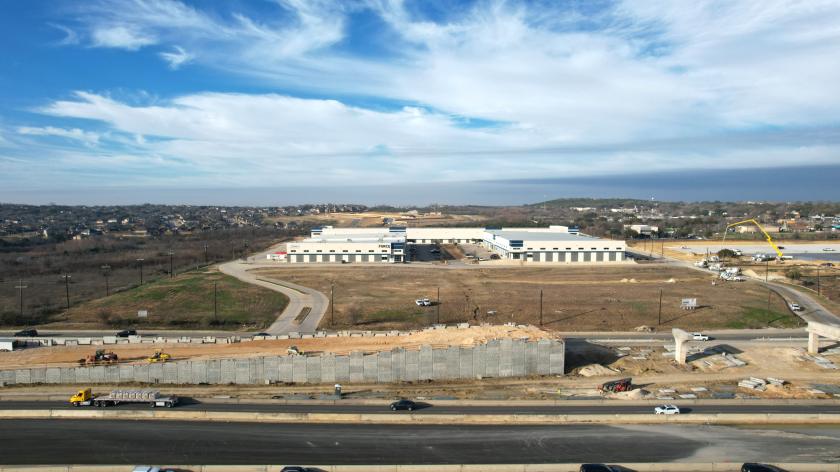
7114 N Loop 1604 E San Antonio, TX 78247
7114 N Loop 1604 E San Antonio, TX 78247
Details & Description
Property Highlights
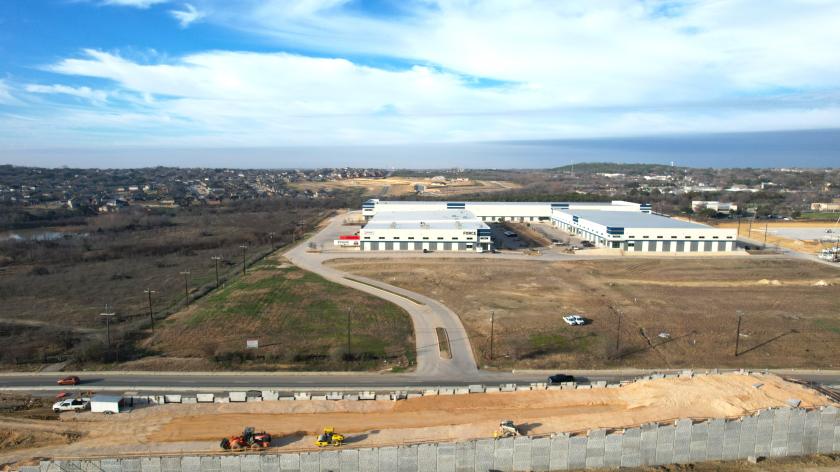
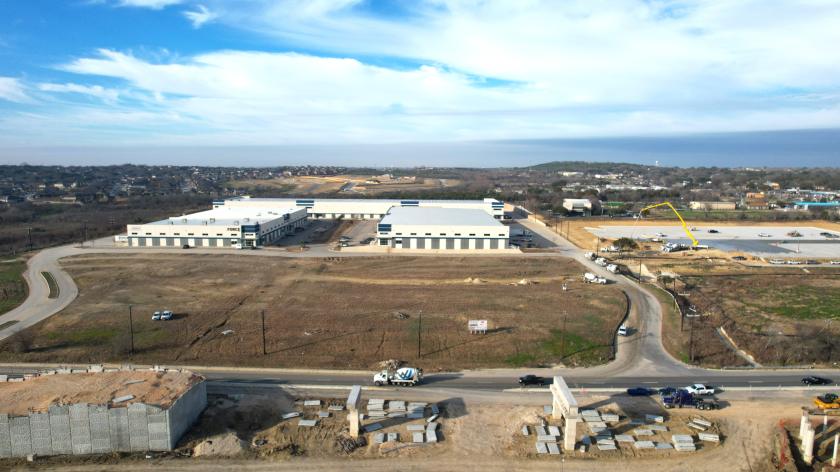
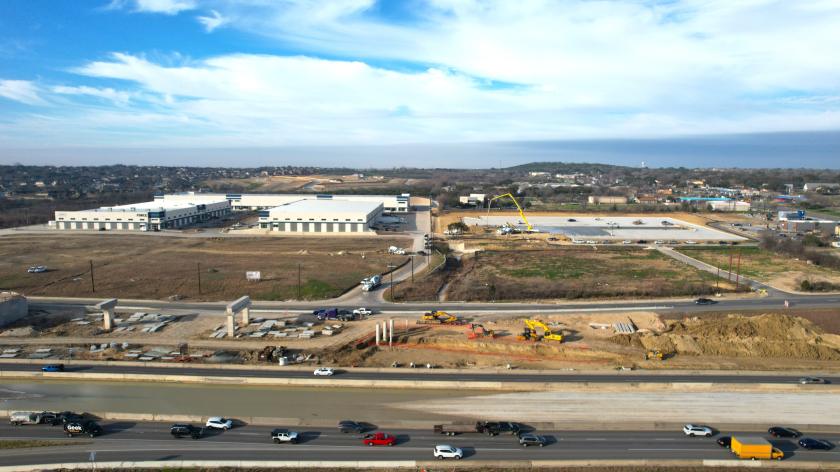
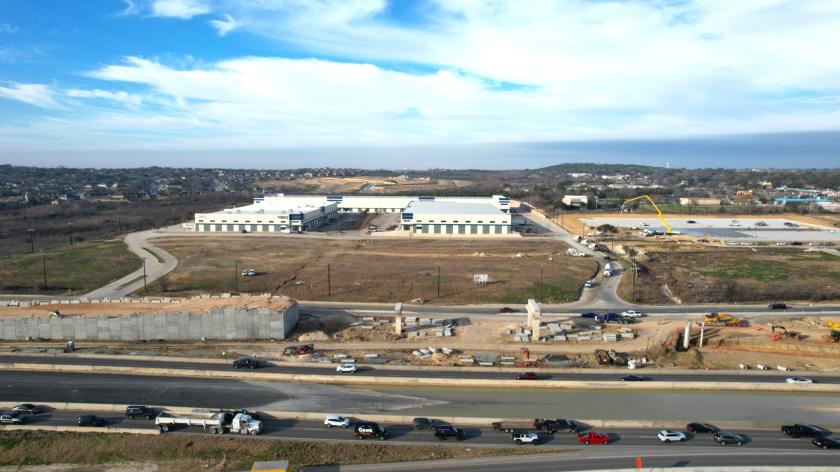
• Close proximity to Walmart, Rolling Oaks Mall, and multiple national restaurants & retailers
• Located at the intersection of Loop 1604 & Nacogdoches Rd (FM 2252)
Additional Photos

Listing Agents

Amanda Powell
O: 210-222-2424
M: 281-733-9545
anelson@dhrp.us
O: 210-222-2424
M: 281-733-9545
anelson@dhrp.us

Matthew Baylor
O: 210-222-2424
M: 210-381-3398
mbaylor@dhrp.us
O: 210-222-2424
M: 210-381-3398
mbaylor@dhrp.us
While we strive to provide the most accurate information, all listing information, and demographic data, is provided by third-parties. As such, MyEListing will not be responsible for the accuracy of the information. It is strongly recommended that you verify all information with the listing agent, and any relevant agencies, prior to making any decisions.