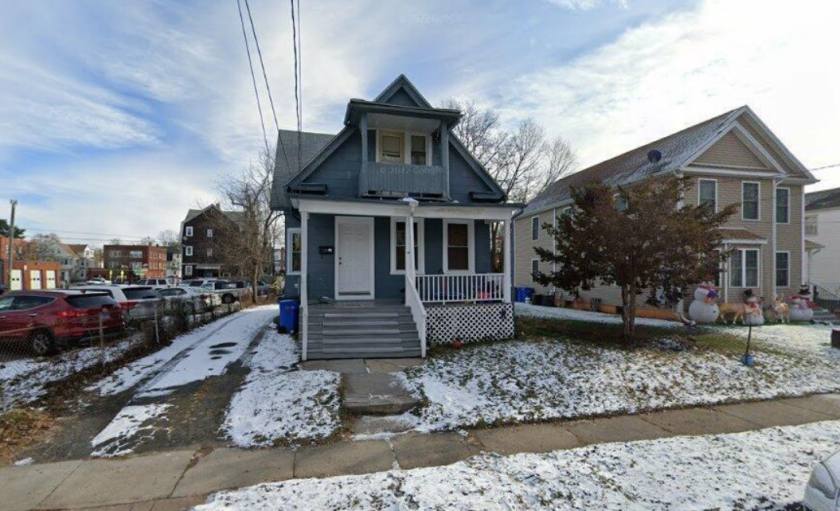
1-Mile | 3-Miles | 5-Miles | ||
---|---|---|---|---|
Total Population | 24,820 | 127,507 | 272,469 | |
Population Median Age | 36 | 37 | 39 | |
Population by Age | 0-9 Yrs | 3119 (12%) | 14446 (11%) | 30694 (11%) |
10-19 Yrs | 4425 (17%) | 17982 (14%) | 36779 (13%) | |
20-29 Yrs | 3383 (13%) | 20357 (15%) | 41463 (15%) | |
30-39 Yrs | 3249 (13%) | 18388 (14%) | 36649 (13%) | |
40-49 Yrs | 3568 (14%) | 16747 (13%) | 34204 (12%) | |
50-59 Yrs | 2924 (11%) | 15511 (12%) | 34959 (12%) | |
60-69 Yrs | 2315 (9%) | 13304 (10%) | 29814 (10%) | |
70+ Yrs | 1838 (7%) | 10772 (8%) | 27907 (10%) | |
Median HH Income | $46,739 | $47,038 | $58,945 | |
Total Household Income | < 24K | 2468 (27%) | 15380 (29%) | 26377 (24%) |
25-49K | 2344 (26%) | 11821 (22%) | 22039 (20%) | |
50-74K | 1536 (17%) | 8494 (16%) | 17386 (15%) | |
75-99K | 1139 (12%) | 5458 (10%) | 11961 (10%) | |
100-199K | 1269 (14%) | 9294 (17%) | 23802 (21%) | |
200K+ | 101 (1%) | 1532 (2%) | 8019 (7%) | |
Highest Education Level | No Diploma | 4547 | 19093 | 29809 |
Diploma or GED | 5190 | 26334 | 51861 | |
Some College | 2909 | 13894 | 29126 | |
Assoc. Degree | 774 | 5559 | 13425 | |
Bachelors Degree | 1295 | 11810 | 33778 | |
Higher Degree | 781 | 8205 | 26793 | |
Total Housing Units | 9,811 | 58,122 | 120,732 | |
--Owner-Occupied | 3,212 | 18,665 | 53,161 | |
--Renter-Occupied | 5,644 | 33,314 | 56,423 | |
Owner-Occupied Values | < 100K | 156 | 1594 | 3210 |
100-199K | 1628 | 8418 | 17844 | |
200-299K | 1168 | 6003 | 17819 | |
300-399K | 208 | 1808 | 8222 | |
400-499K | 15 | 439 | 3343 | |
500K+ | 37 | 403 | 2723 | |
Total Working Age Population | 19,194 | 103,331 | 221,070 | |
In Work Force | 12,969 | 67,193 | 144,026 | |
Not In Work Force | 6,224 | 36,138 | 77,044 | |
Workforce Employed | 11,723 | 60,795 | 132,990 | |
Workforce Unemployed | 1,246 | 6,243 | 10,777 | |
Civlian Workforce | 12,969 | 67,038 | 143,767 | |
Military Workforce | 0 | 155 | 259 | |
Total Households | 8,855 | 51,979 | 109,584 | |
Family Households | 5,898 | 28,513 | 64,141 | |
Non-Family Households | 2,957 | 23,466 | 45,443 | |
Married Couple | 2,385 | 14,438 | 37,146 | |
Other Family | 3,513 | 14,075 | 26,995 | |
Married w/Child | 1,151 | 5,808 | 15,257 | |
Single Male w/Child | 298 | 1,507 | 2,608 | |
Single Female w/Child | 1,414 | 5,621 | 10,365 |
Population Change Last Two Decades - Plus Projection
2000 | % | 2010 | % | 2020 | % | 2030 | |
---|---|---|---|---|---|---|---|
Connecticut | 3,405,565 | +5 | 3,574,097 | +1 | 3,604,603 | +1 | 3,633,994 |
Hartford County | 857,183 | +4 | 894,014 | +2 | 909,671 | +2 | 930,629 |
Total Working Age Population:
Total Households:
Total Working Age Population:
Total Households:
Total Working Age Population:
Total Households: