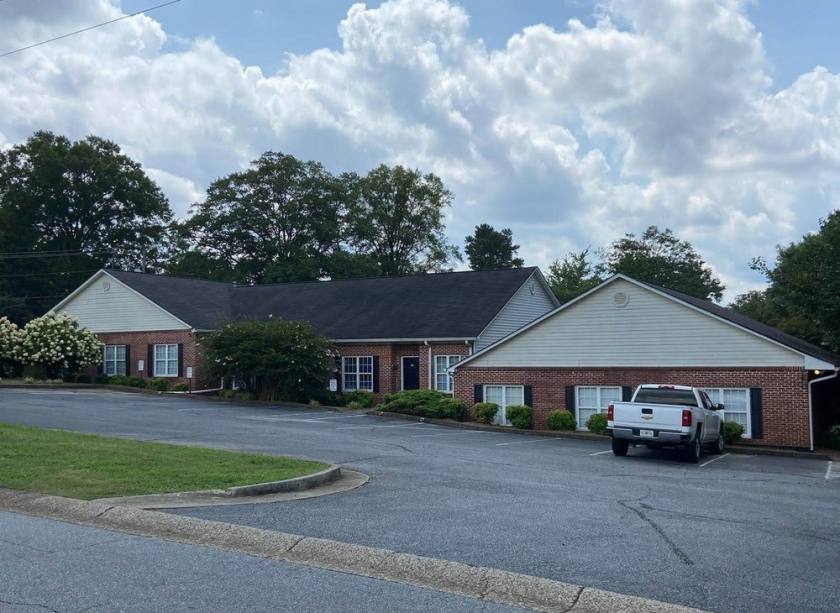
Office Space
3185 Cherokee Street Northwest Kennesaw, GA 30144
3185 Cherokee Street Northwest Kennesaw, GA 30144
Details & Description
Property Highlights
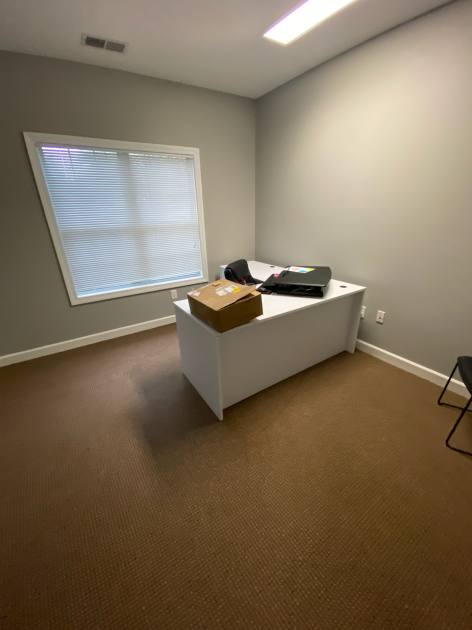
• Suite offers 8 offices, conference room, reception area and kitchenette in break area
• Located between US 41 (Cobb Pkwy) and I-75 for easy access
Additional Photos


Listing Agents

Donald Edwards Jr.
O: 678-298-1622
M: 770-324-3457
don@dbeproperties.com
O: 678-298-1622
M: 770-324-3457
don@dbeproperties.com
While we strive to provide the most accurate information, all listing information, and demographic data, is provided by third-parties. As such, MyEListing will not be responsible for the accuracy of the information. It is strongly recommended that you verify all information with the listing agent, and any relevant agencies, prior to making any decisions.