Commercial Land
4100 Country Meadows Dr Edinburg, TX 78541
4100 Country Meadows Dr Edinburg, TX 78541
Details & Description
Property Highlights
- • All utilities available to the site
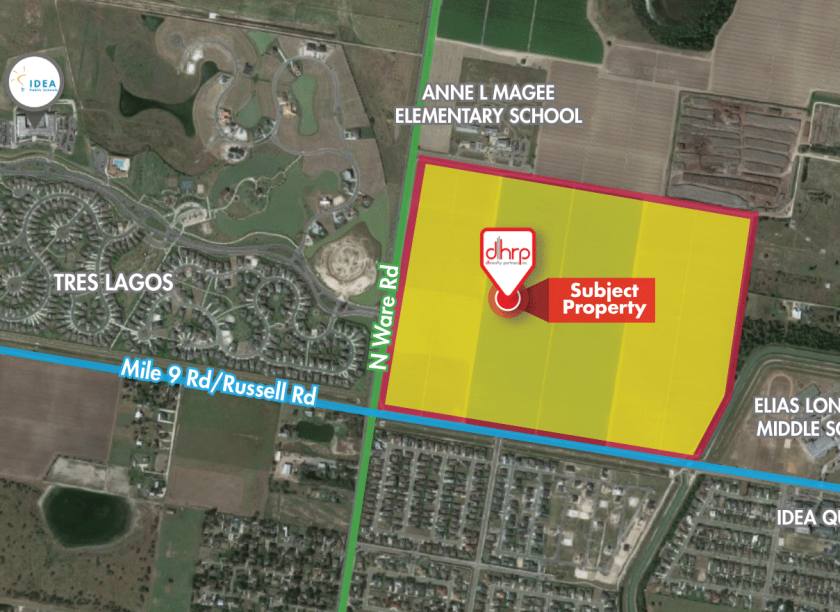
- • Easy ingress/egress to adjacent thoroughfares
- • Level topography
- • Ideal for a wide variety of commercial uses
Additional Photos


Listing Agents

Aisha Ahmed
O: 210-222-2424
M: 210-317-7769
aisha@dhrp.us
O: 210-222-2424
M: 210-317-7769
aisha@dhrp.us
While we strive to provide the most accurate information, all listing information, and demographic data, is provided by third-parties. As such, MyEListing will not be responsible for the accuracy of the information. It is strongly recommended that you verify all information with the listing agent, and any relevant agencies, prior to making any decisions.


