Retail Space
3400 - 3498 Vollmer Rd Olympia Fields, IL 60461
3400 - 3498 Vollmer Rd Olympia Fields, IL 60461

Details & Description
Property Highlights
• Strong historical occupancy with 80% of the current tenant GLA in place since 2012 or earlier. Longest tenant d
• 100% occupied grocery anchored shopping center with +/-12,000 SF vacant outlot building for value-add upside
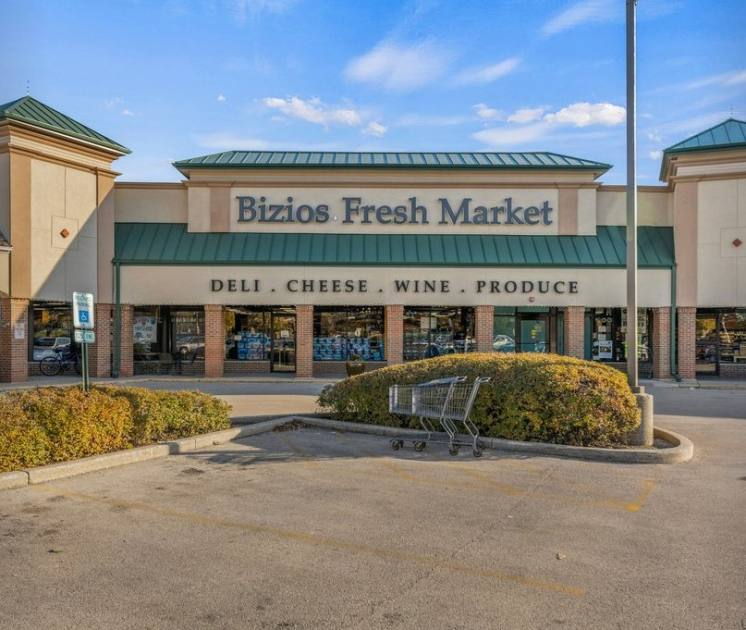
Additional Photos


Listing Agents

Autumn Psaros
O: 224-218-5447
M: 574-707-5434
autumn@catoncommercial.com
O: 224-218-5447
M: 574-707-5434
autumn@catoncommercial.com
While we strive to provide the most accurate information, all listing information, and demographic data, is provided by third-parties. As such, MyEListing will not be responsible for the accuracy of the information. It is strongly recommended that you verify all information with the listing agent, and any relevant agencies, prior to making any decisions.


