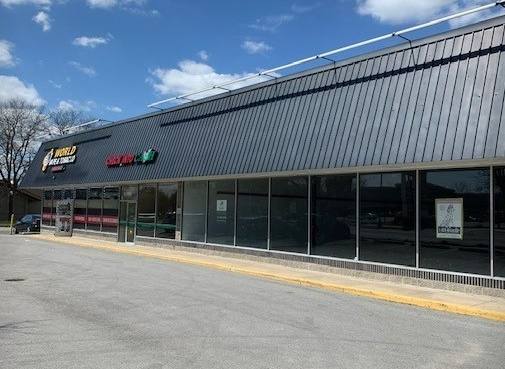
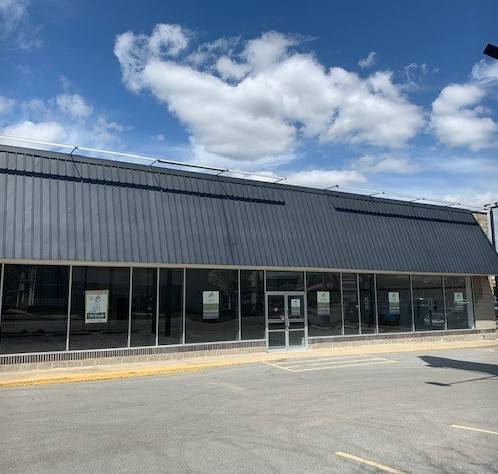
Retail Space
2155 - 2159 W Jefferson St Joliet, IL 60435
2155 - 2159 W Jefferson St Joliet, IL 60435
Details & Description
Property Highlights
- • Excellent opportunity for owner/user
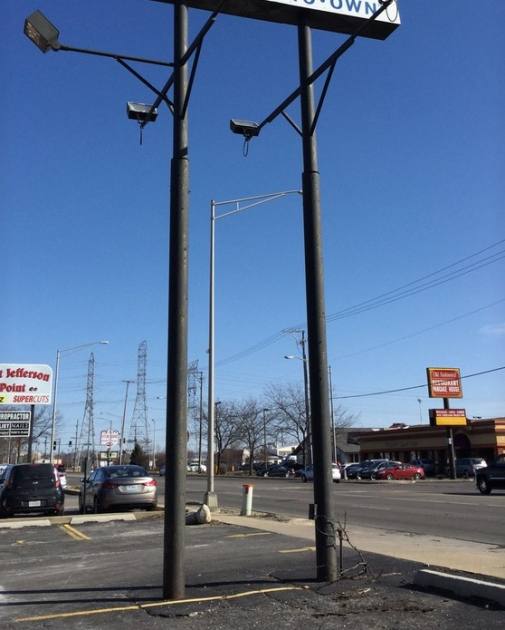
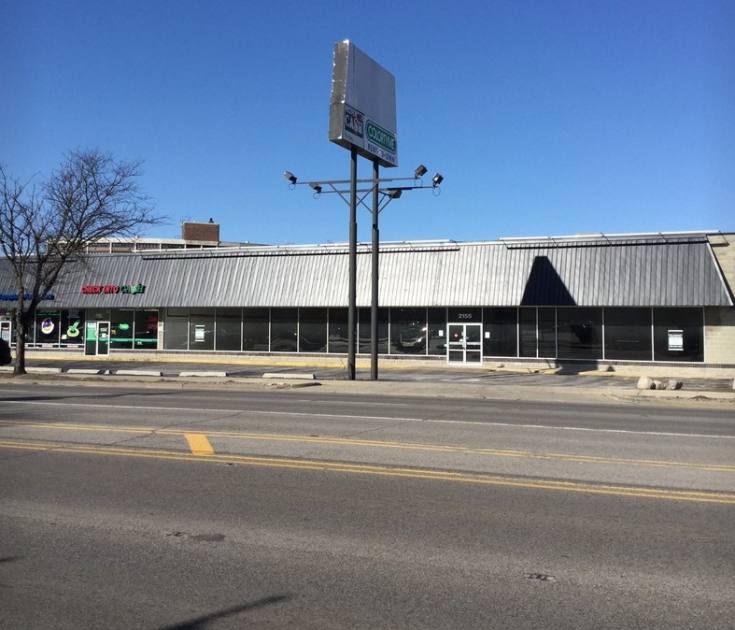
- • 31,000 vehicles per day pass this center
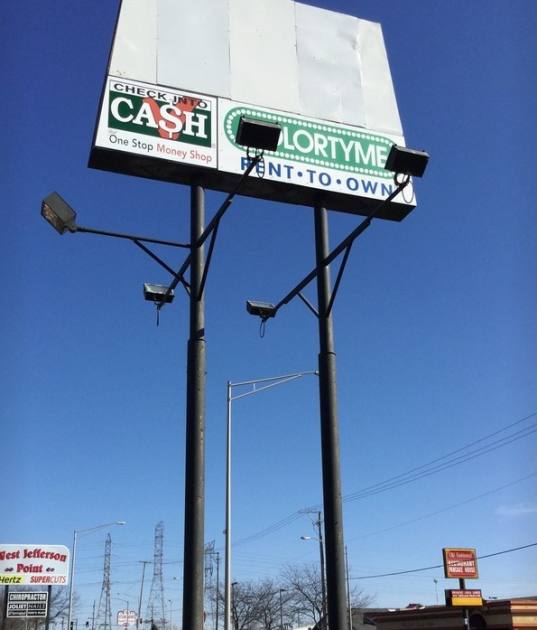
- • High visibility signage
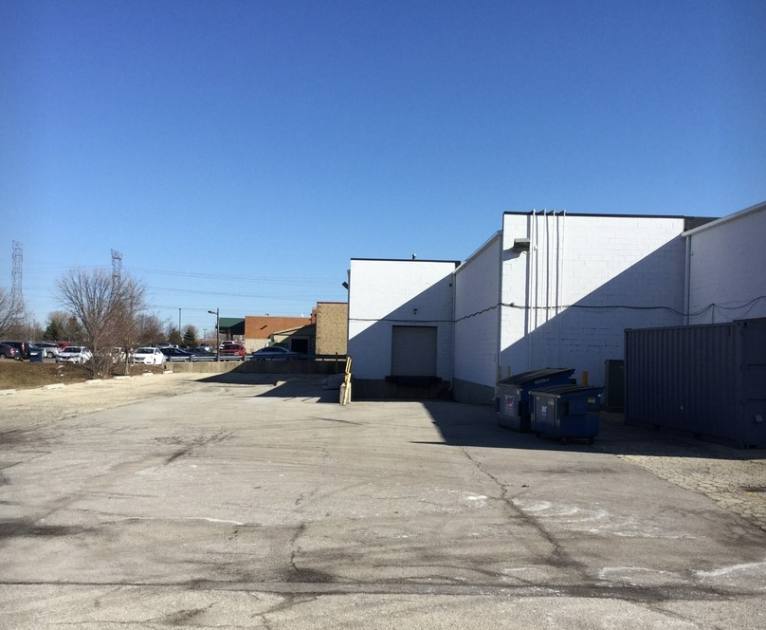
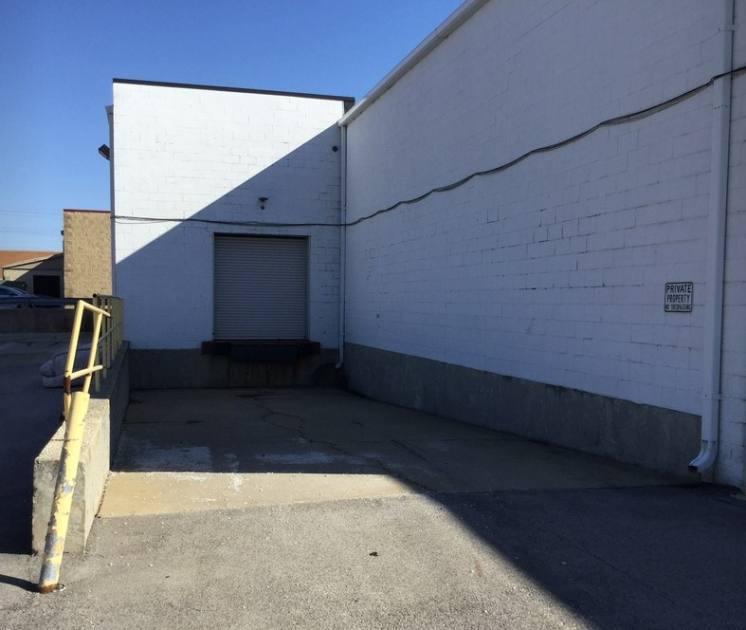
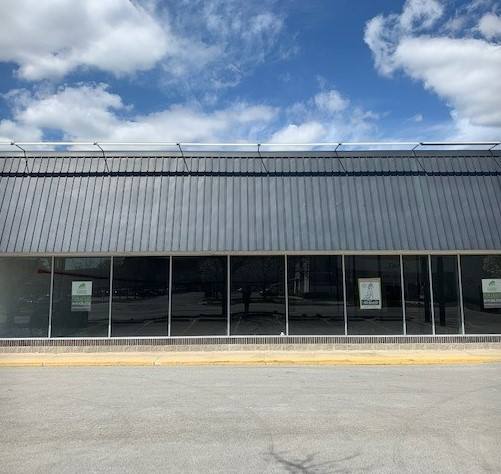
Additional Photos
Listing Agents

Andy Velkme
O: 815-436-5700
M: 312-203-8441
andy@catoncommercial.com
O: 815-436-5700
M: 312-203-8441
andy@catoncommercial.com

Rich Bowden
O: 815-436-5700
M: 815-252-7963
rich@catoncommercial.com
O: 815-436-5700
M: 815-252-7963
rich@catoncommercial.com
While we strive to provide the most accurate information, all listing information, and demographic data, is provided by third-parties. As such, MyEListing will not be responsible for the accuracy of the information. It is strongly recommended that you verify all information with the listing agent, and any relevant agencies, prior to making any decisions.