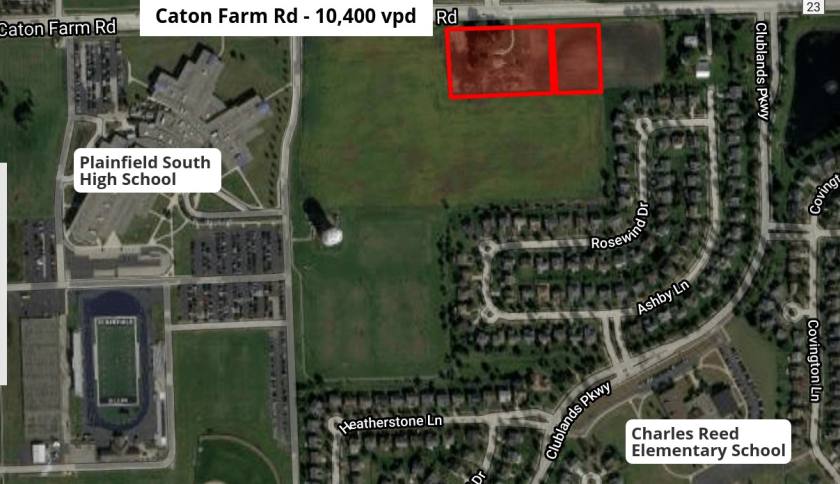
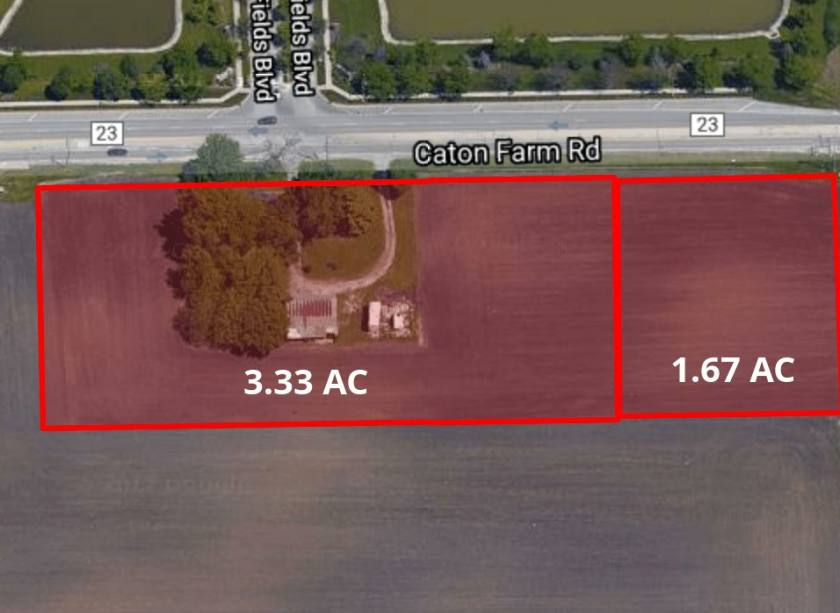
1-Mile | 3-Miles | 5-Miles | ||
---|---|---|---|---|
Total Population | 7,979 | 37,526 | 85,180 | |
Population Median Age | 32 | 32 | 36 | |
Population by Age | 0-9 Yrs | 1092 (13%) | 5863 (15%) | 11563 (13%) |
10-19 Yrs | 1665 (20%) | 6628 (17%) | 14114 (16%) | |
20-29 Yrs | 1272 (15%) | 5180 (13%) | 10952 (12%) | |
30-39 Yrs | 709 (8%) | 5386 (14%) | 10917 (12%) | |
40-49 Yrs | 1657 (20%) | 6390 (17%) | 13463 (15%) | |
50-59 Yrs | 750 (9%) | 4562 (12%) | 10601 (12%) | |
60-69 Yrs | 523 (6%) | 2394 (6%) | 8347 (9%) | |
70+ Yrs | 311 (3%) | 1123 (2%) | 5221 (6%) | |
Median HH Income | $102,220 | $112,840 | $107,407 | |
Total Household Income | < 24K | 315 (13%) | 650 (6%) | 1759 (6%) |
25-49K | 153 (6%) | 791 (7%) | 2590 (9%) | |
50-74K | 277 (11%) | 1234 (11%) | 3935 (14%) | |
75-99K | 368 (15%) | 1515 (14%) | 3629 (13%) | |
100-199K | 1032 (44%) | 5195 (49%) | 11555 (43%) | |
200K+ | 182 (7%) | 1117 (10%) | 2880 (10%) | |
Highest Education Level | No Diploma | 576 | 1728 | 3523 |
Diploma or GED | 987 | 5673 | 13703 | |
Some College | 1182 | 5529 | 13206 | |
Assoc. Degree | 226 | 1720 | 4761 | |
Bachelors Degree | 1188 | 4981 | 11801 | |
Higher Degree | 508 | 2622 | 6860 | |
Total Housing Units | 2,360 | 10,725 | 26,953 | |
--Owner-Occupied | 2,122 | 9,731 | 23,644 | |
--Renter-Occupied | 206 | 771 | 2,704 | |
Owner-Occupied Values | < 100K | 50 | 209 | 652 |
100-199K | 406 | 1744 | 5267 | |
200-299K | 1539 | 5852 | 11843 | |
300-399K | 123 | 1497 | 4544 | |
400-499K | 3 | 237 | 706 | |
500K+ | 0 | 192 | 631 | |
Total Working Age Population | 5,642 | 27,005 | 64,114 | |
In Work Force | 4,322 | 20,936 | 46,811 | |
Not In Work Force | 1,320 | 6,069 | 17,303 | |
Workforce Employed | 3,890 | 19,844 | 44,300 | |
Workforce Unemployed | 432 | 1,073 | 2,473 | |
Civlian Workforce | 4,322 | 20,917 | 46,773 | |
Military Workforce | 0 | 19 | 38 | |
Total Households | 2,328 | 10,503 | 26,348 | |
Family Households | 1,949 | 9,317 | 21,784 | |
Non-Family Households | 379 | 1,186 | 4,564 | |
Married Couple | 1,406 | 7,483 | 17,803 | |
Other Family | 542 | 1,834 | 3,981 | |
Married w/Child | 845 | 4,423 | 8,974 | |
Single Male w/Child | 99 | 268 | 599 | |
Single Female w/Child | 365 | 929 | 1,675 |
Population Change Last Two Decades - Plus Projection
2000 | % | 2010 | % | 2020 | % | 2030 | |
---|---|---|---|---|---|---|---|
Illinois | 12,419,293 | +3 | 12,830,632 | +12 | 14,316,487 | +6 | 15,138,849 |
Kendall County | 54,544 | +110 | 114,736 | -31 | 78,694 | +8 | 85,060 |
Will County | 502,266 | +35 | 677,560 | +34 | 907,625 | +20 | 1,093,207 |
Total Working Age Population:
Total Households:
Total Working Age Population:
Total Households:
Total Working Age Population:
Total Households: