Commercial Land
Lakeview Ct Unit 6 Romeoville, IL 60446
Lakeview Ct Unit 6 Romeoville, IL 60446
Details & Description
Property Highlights
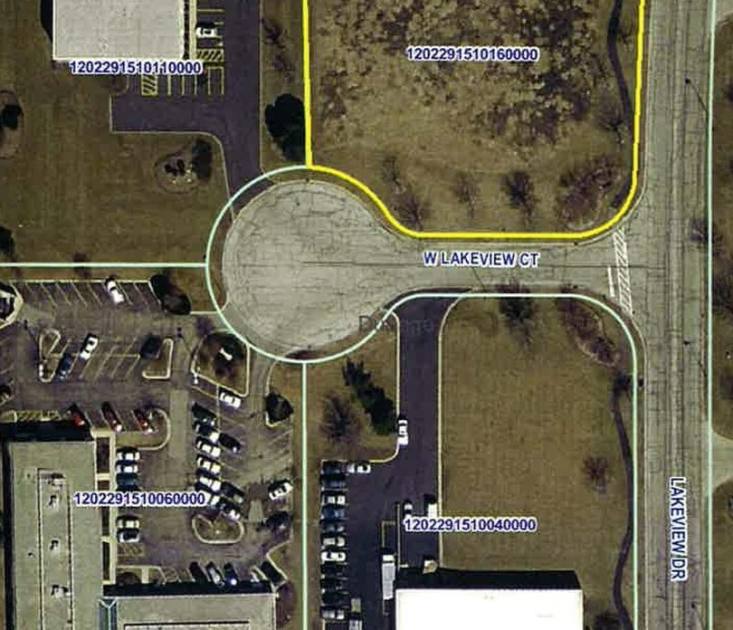
- • 1.2+ Acres on cul de sac in Industrial Park
- • Zoned I-1
- • 224' of frontage on Lakeview Dr
Listing Agents

Bill Caton
O: 815-370-1236
M: 331-333-1155
bill@catoncommercial.com
O: 815-370-1236
M: 331-333-1155
bill@catoncommercial.com
While we strive to provide the most accurate information, all listing information, and demographic data, is provided by third-parties. As such, MyEListing will not be responsible for the accuracy of the information. It is strongly recommended that you verify all information with the listing agent, and any relevant agencies, prior to making any decisions.