Office Space
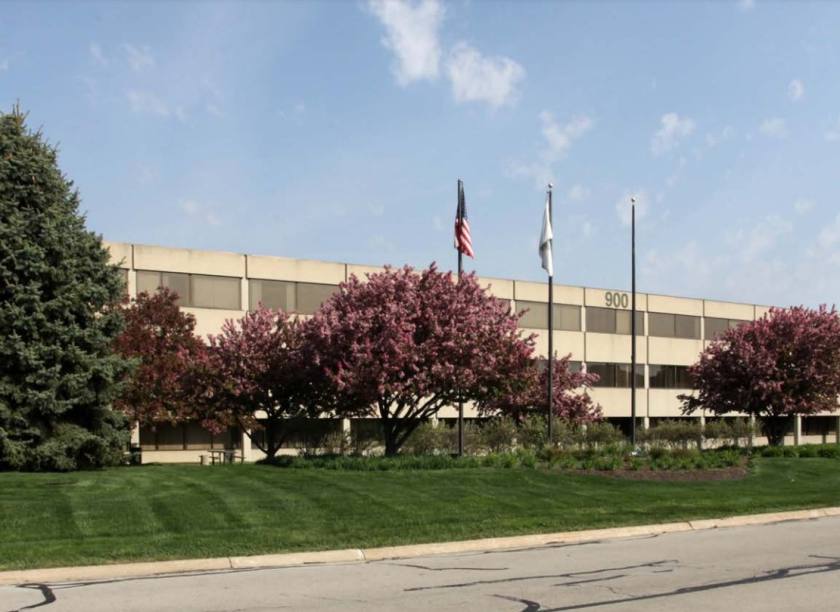
900 Commerce Drive Oak Brook, IL 60523
900 Commerce Drive Oak Brook, IL 60523
Details & Description
Property Highlights
• Great Location With Easy Access
• Great Location With Easy Access
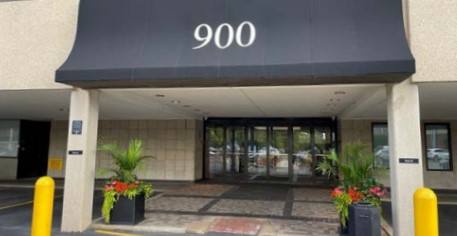
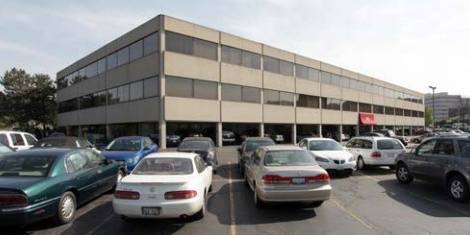
Additional Photos


Listing Agents

Brent Jacob
O: 847-698-8215
brent.jacob@colliers.com
O: 847-698-8215
brent.jacob@colliers.com

Dave Florent
O: 847-698-8258
david.florent@colliers.com
O: 847-698-8258
david.florent@colliers.com
While we strive to provide the most accurate information, all listing information, and demographic data, is provided by third-parties. As such, MyEListing will not be responsible for the accuracy of the information. It is strongly recommended that you verify all information with the listing agent, and any relevant agencies, prior to making any decisions.