Office Space
6250 North River Road Rosemont, IL 60018
6250 North River Road Rosemont, IL 60018

Details & Description
Property Highlights
• Convenient from I-90, I-294 and I-90, CTA Blue Line, Metra rail lines and O'Hare International Airport
• Strategically located in the O'Hare suburban office submarket, 17 miles northwest of Downtown
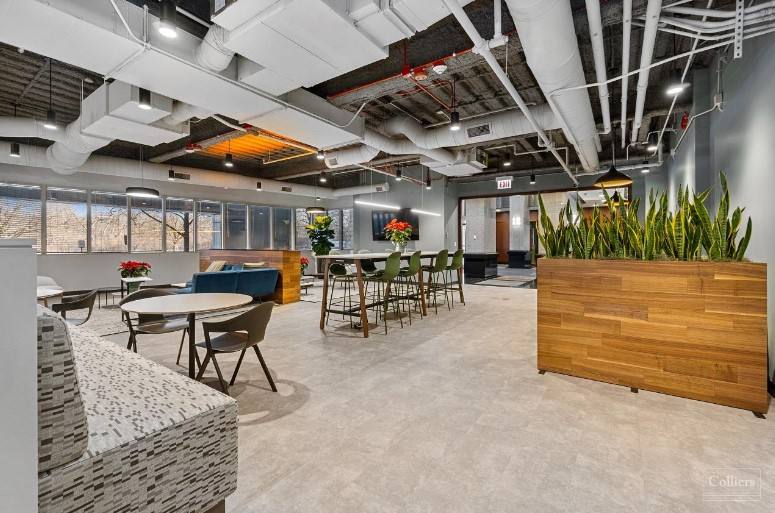
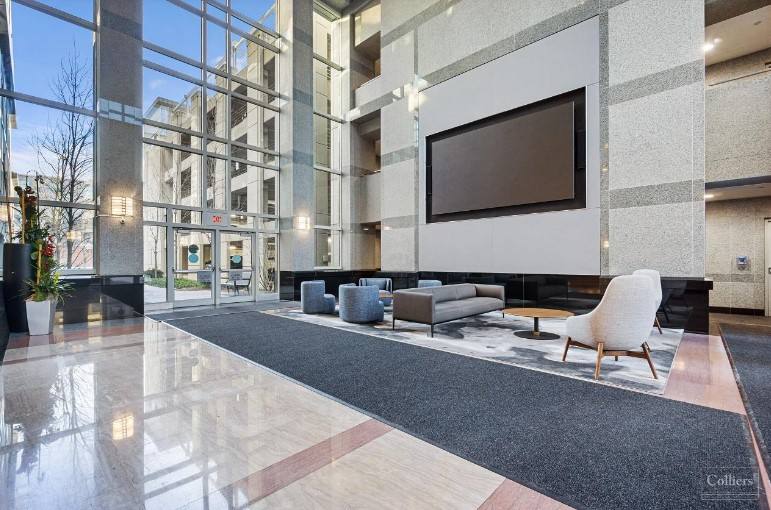
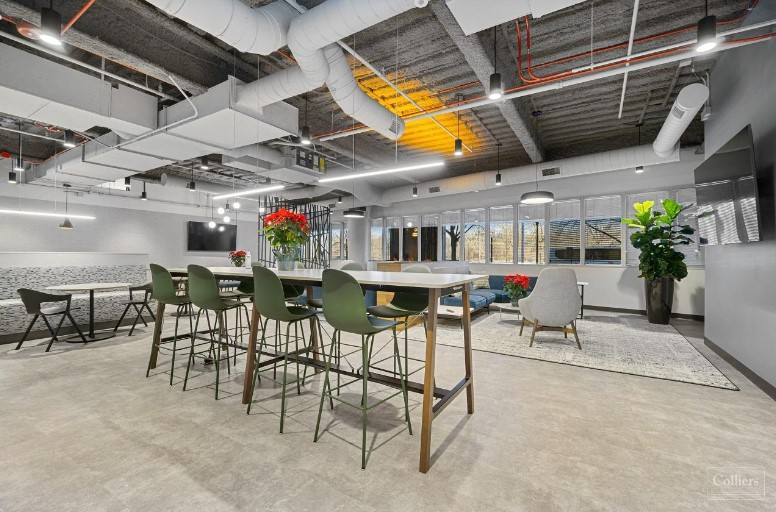
Additional Photos


Listing Agents

Francis Prock
O: 847-698-8257
M: 847-822-1071
francis.prock@colliers.com
O: 847-698-8257
M: 847-822-1071
francis.prock@colliers.com

Jonathon Connor
O: 847-698-8246
M: 847-436-6664
jonathon.connor@colliers.com
O: 847-698-8246
M: 847-436-6664
jonathon.connor@colliers.com
While we strive to provide the most accurate information, all listing information, and demographic data, is provided by third-parties. As such, MyEListing will not be responsible for the accuracy of the information. It is strongly recommended that you verify all information with the listing agent, and any relevant agencies, prior to making any decisions.