Office Space
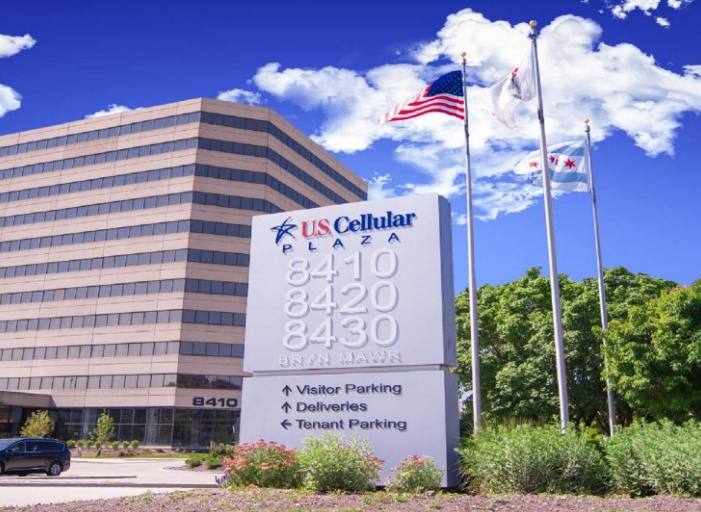
8410-8430 W Bryn Mawr Ave Chicago, IL 60631
8410-8430 W Bryn Mawr Ave Chicago, IL 60631
Details & Description
Property Highlights
- • Best access in the O'Hare area
- • Energy Star Rated
- • Michael's on Main delicatessen
- • Adjacent to Renaissance Hotel
- • On-site management
- • 24-hour security service
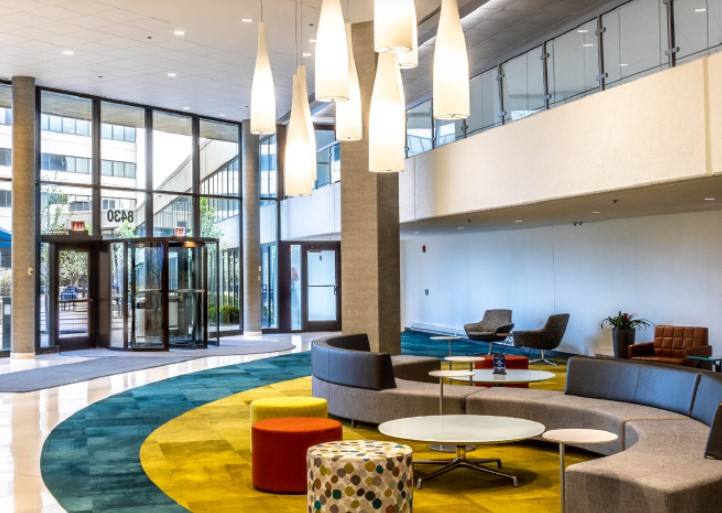
Additional Photos


Listing Agents

Francis Prock
O: 847-698-8257
M: 847-822-1071
francis.prock@colliers.com
O: 847-698-8257
M: 847-822-1071
francis.prock@colliers.com

Jonathon Connor
O: 847-698-8246
M: 847-436-6664
jonathon.connor@colliers.com
O: 847-698-8246
M: 847-436-6664
jonathon.connor@colliers.com

Jason Simon
O: 847-698-8531
M: 312-259-8207
jason.simon@colliers.com
O: 847-698-8531
M: 312-259-8207
jason.simon@colliers.com
While we strive to provide the most accurate information, all listing information, and demographic data, is provided by third-parties. As such, MyEListing will not be responsible for the accuracy of the information. It is strongly recommended that you verify all information with the listing agent, and any relevant agencies, prior to making any decisions.


