Specialty Real Estate
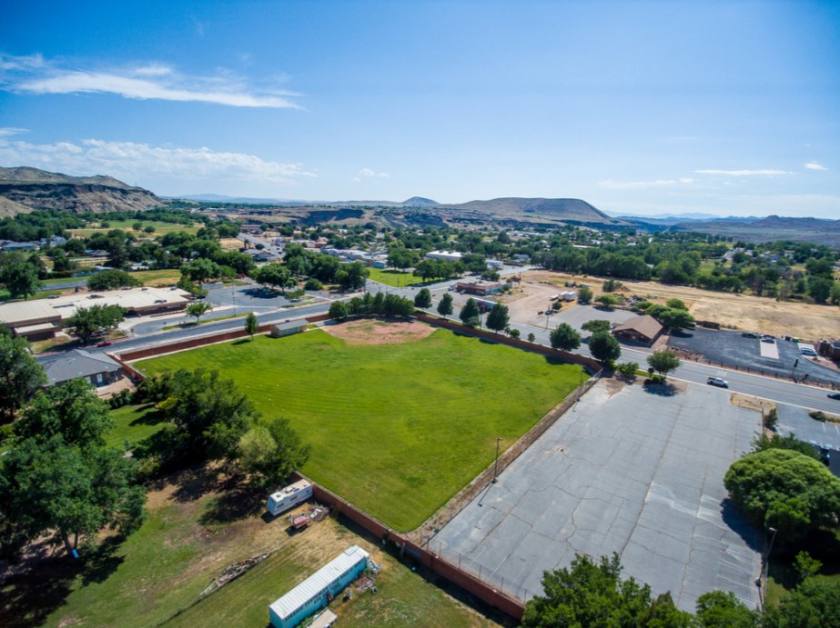
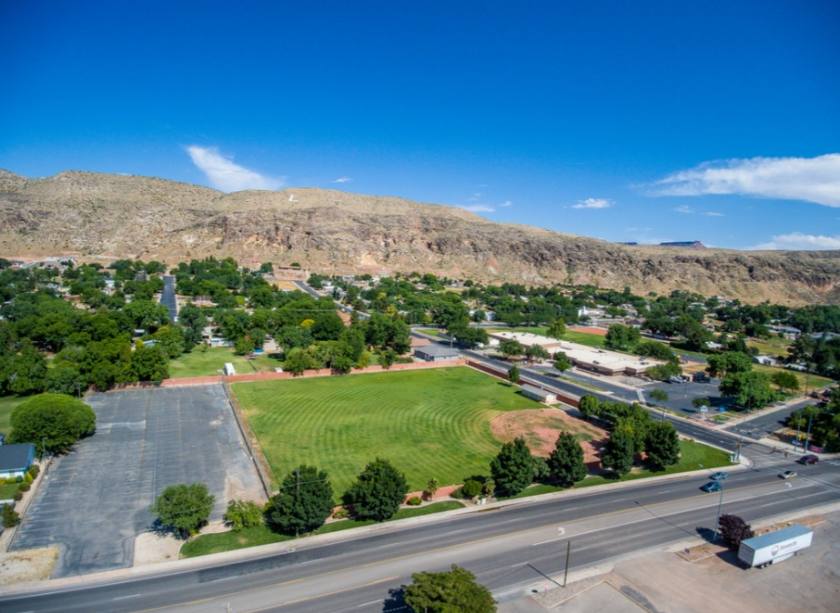
80 West Center Street La Verkin, UT 84745
80 West Center Street La Verkin, UT 84745
Details & Description
Listing Agents

Tom Callister
O: 435-359-4902
tom@linxcre.com
O: 435-359-4902
tom@linxcre.com
While we strive to provide the most accurate information, all listing information, and demographic data, is provided by third-parties. As such, MyEListing will not be responsible for the accuracy of the information. It is strongly recommended that you verify all information with the listing agent, and any relevant agencies, prior to making any decisions.