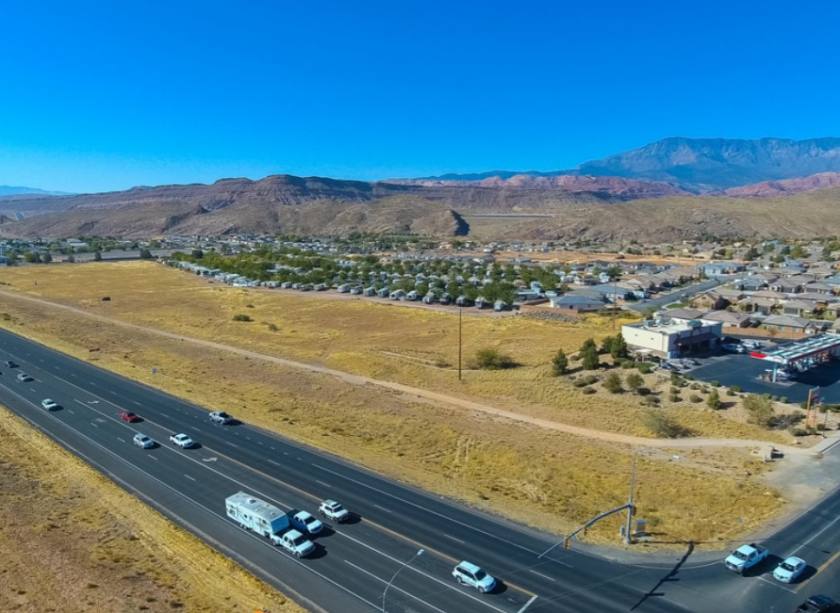
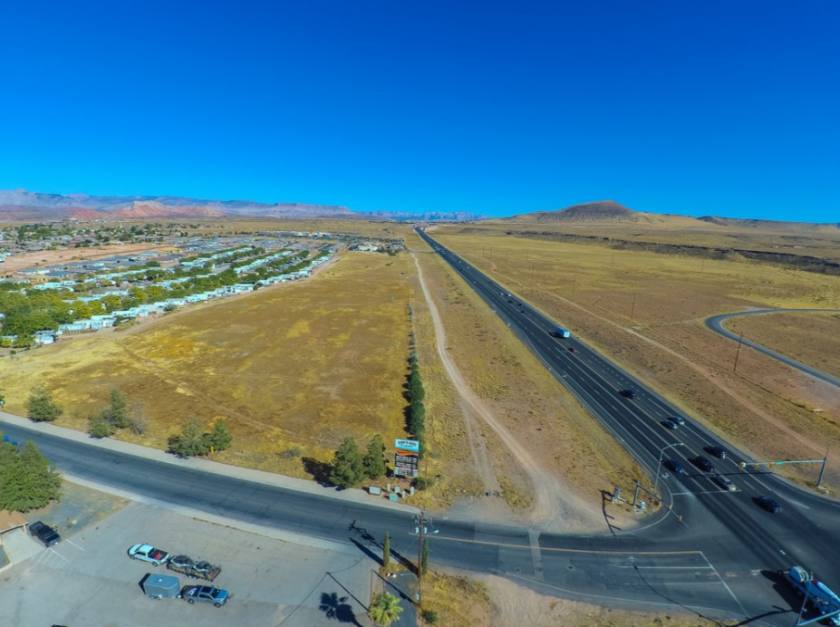
1-Mile | 3-Miles | 5-Miles | ||
---|---|---|---|---|
Total Population | 1,135 | 5,903 | 15,147 | |
Population Median Age | 35 | 41 | 39 | |
Population by Age | 0-9 Yrs | 261 (22%) | 1005 (17%) | 2262 (14%) |
10-19 Yrs | 126 (11%) | 562 (9%) | 2030 (13%) | |
20-29 Yrs | 115 (10%) | 519 (8%) | 1451 (9%) | |
30-39 Yrs | 190 (16%) | 911 (15%) | 2340 (15%) | |
40-49 Yrs | 123 (10%) | 572 (9%) | 1662 (10%) | |
50-59 Yrs | 96 (8%) | 561 (9%) | 1389 (9%) | |
60-69 Yrs | 100 (8%) | 897 (15%) | 2077 (13%) | |
70+ Yrs | 124 (10%) | 876 (14%) | 1936 (12%) | |
Median HH Income | $56,813 | $53,188 | $57,297 | |
Total Household Income | < 24K | 76 (20%) | 491 (22%) | 992 (19%) |
25-49K | 83 (22%) | 526 (24%) | 1147 (22%) | |
50-74K | 64 (16%) | 410 (18%) | 940 (18%) | |
75-99K | 107 (28%) | 496 (22%) | 891 (17%) | |
100-199K | 45 (11%) | 205 (9%) | 877 (17%) | |
200K+ | 1 (0%) | 58 (2%) | 187 (3%) | |
Highest Education Level | No Diploma | 74 | 350 | 635 |
Diploma or GED | 167 | 1136 | 2833 | |
Some College | 251 | 1385 | 3273 | |
Assoc. Degree | 115 | 560 | 1370 | |
Bachelors Degree | 61 | 428 | 1266 | |
Higher Degree | 33 | 224 | 710 | |
Total Housing Units | 422 | 2,629 | 6,030 | |
--Owner-Occupied | 271 | 1,482 | 3,621 | |
--Renter-Occupied | 106 | 705 | 1,412 | |
Owner-Occupied Values | < 100K | 29 | 128 | 256 |
100-199K | 78 | 415 | 812 | |
200-299K | 128 | 634 | 1298 | |
300-399K | 30 | 215 | 741 | |
400-499K | 2 | 51 | 294 | |
500K+ | 3 | 39 | 220 | |
Total Working Age Population | 793 | 4,508 | 11,557 | |
In Work Force | 564 | 2,554 | 6,546 | |
Not In Work Force | 230 | 1,954 | 5,011 | |
Workforce Employed | 558 | 2,522 | 6,448 | |
Workforce Unemployed | 5 | 30 | 81 | |
Civlian Workforce | 563 | 2,552 | 6,530 | |
Military Workforce | 0 | 2 | 17 | |
Total Households | 377 | 2,187 | 5,033 | |
Family Households | 277 | 1,615 | 3,808 | |
Non-Family Households | 100 | 572 | 1,224 | |
Married Couple | 220 | 1,342 | 3,238 | |
Other Family | 57 | 273 | 570 | |
Married w/Child | 107 | 484 | 1,246 | |
Single Male w/Child | 26 | 87 | 198 | |
Single Female w/Child | 19 | 86 | 179 |
Population Change Last Two Decades - Plus Projection
2000 | % | 2010 | % | 2020 | % | 2030 | |
---|---|---|---|---|---|---|---|
Utah | 2,233,169 | +24 | 2,763,885 | +20 | 3,325,425 | +17 | 3,889,310 |
Washington County | 90,354 | +53 | 138,115 | +35 | 186,618 | +35 | 251,636 |
Total Working Age Population:
Total Households:
Total Working Age Population:
Total Households:
Total Working Age Population:
Total Households: