Retail Space
1250 West Sunset Boulevard St George, UT 84770
1250 West Sunset Boulevard St George, UT 84770
Details & Description
Property Highlights
- • New Retail Space under construction
- • New Modern Design Retail Space
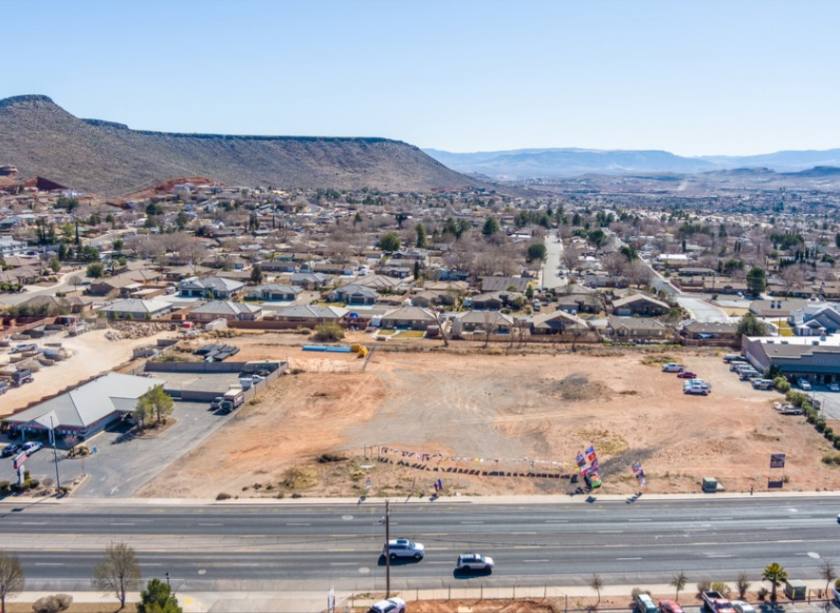
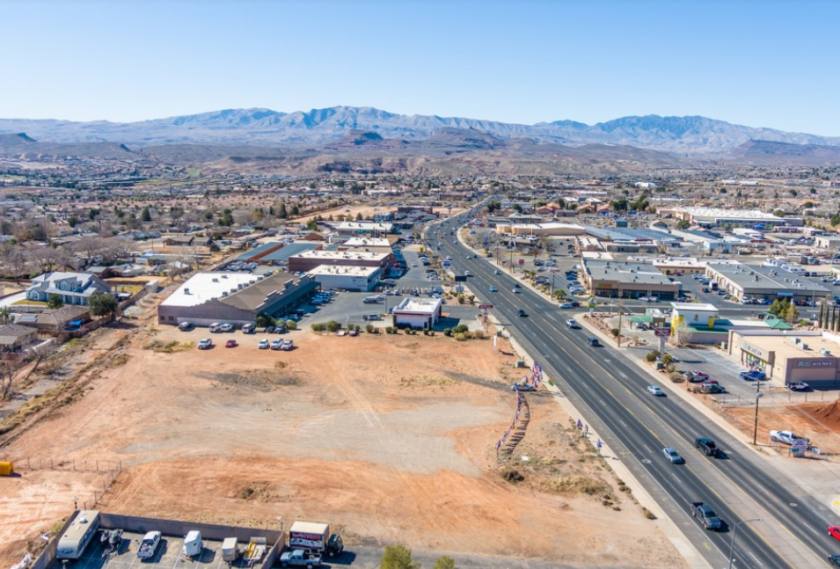
- • Sunset Blvd. frontage & visibility
- • High traffic counts
- • Project is under construction
Additional Photos


Listing Agents

Tom Callister
O: 435-359-4902
tom@linxcre.com
O: 435-359-4902
tom@linxcre.com
While we strive to provide the most accurate information, all listing information, and demographic data, is provided by third-parties. As such, MyEListing will not be responsible for the accuracy of the information. It is strongly recommended that you verify all information with the listing agent, and any relevant agencies, prior to making any decisions.


