Retail Space
6708 US Highway 87 East San Antonio, TX 78263
6708 US Highway 87 East San Antonio, TX 78263
Details & Description
Property Highlights
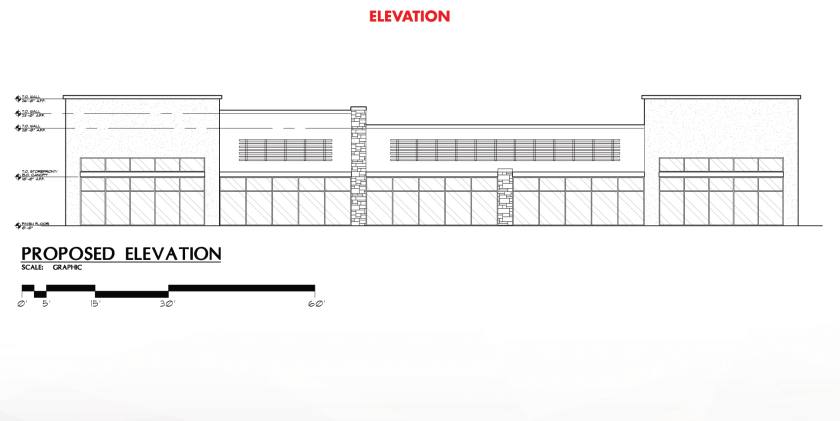
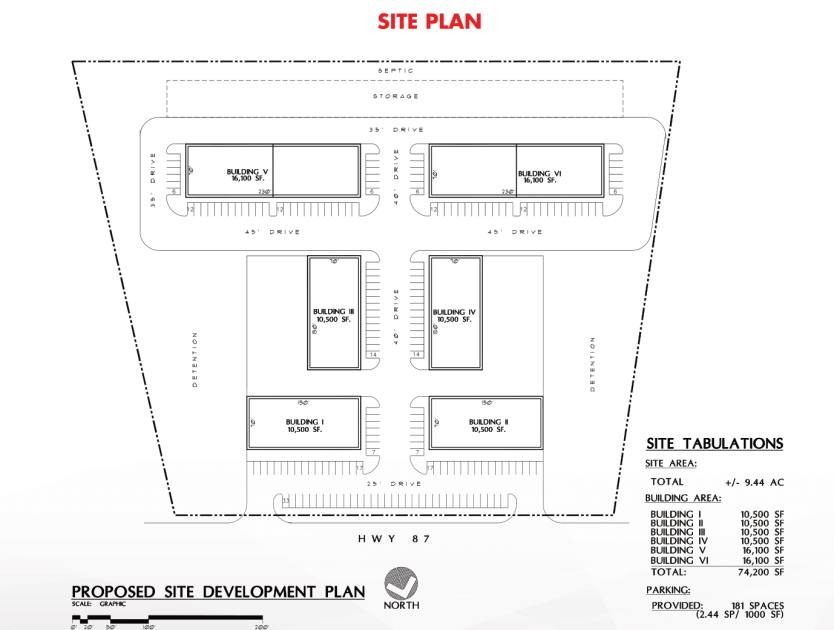
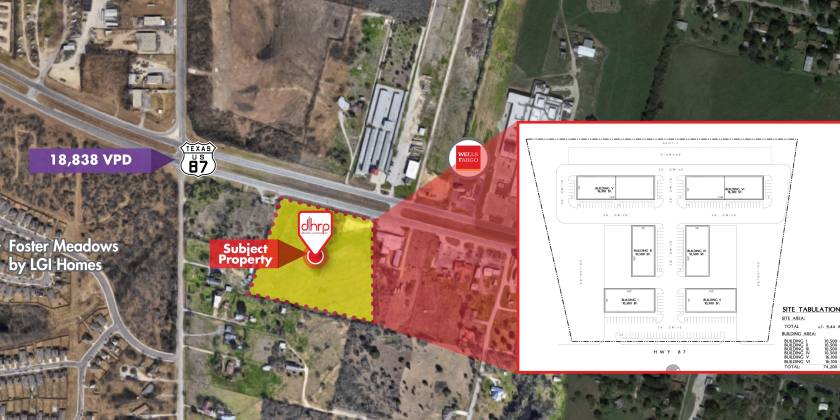
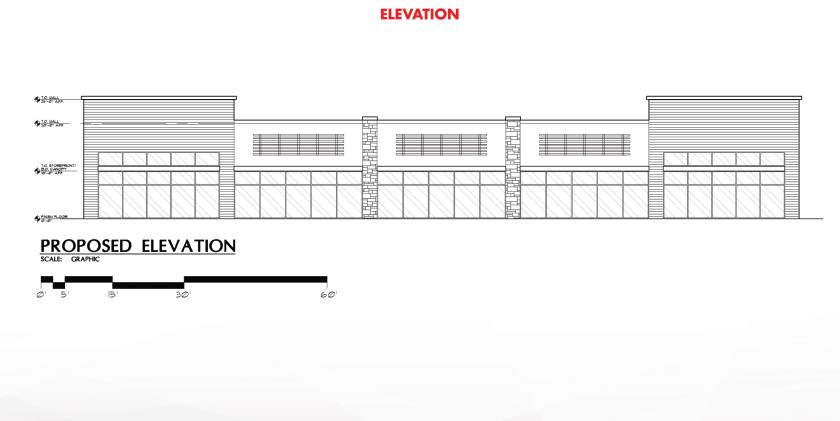
- • BRAND NEW construction retail and office/warehouse
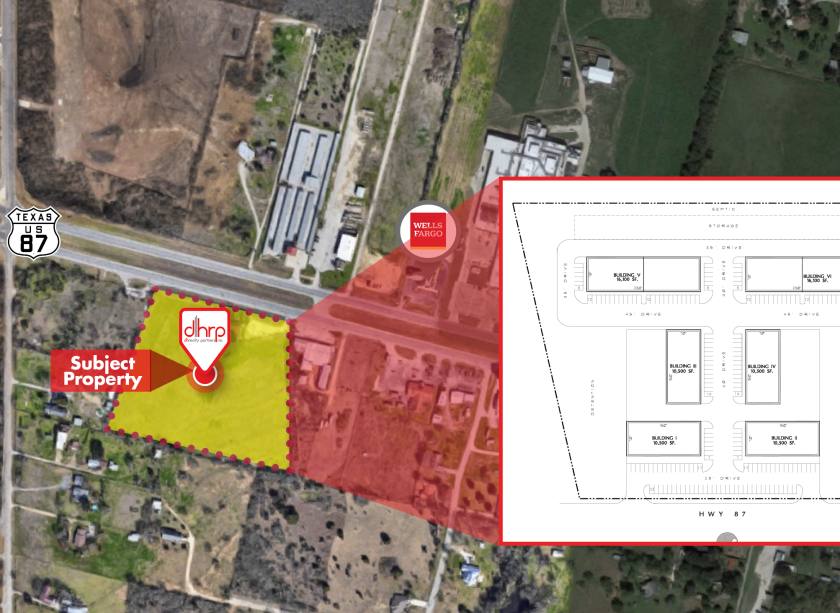
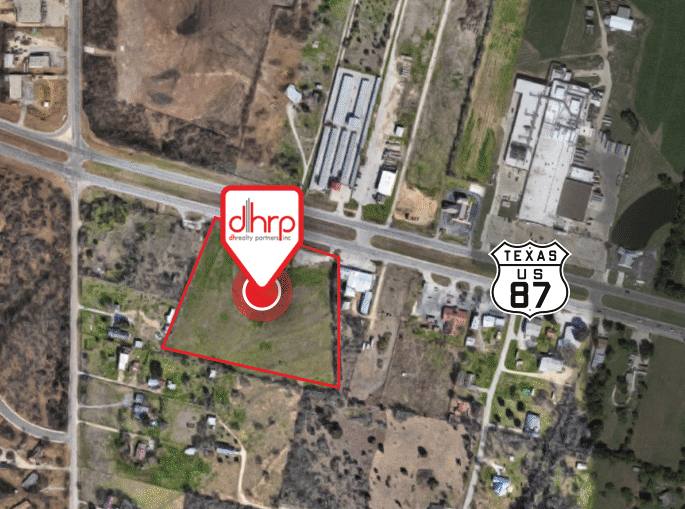
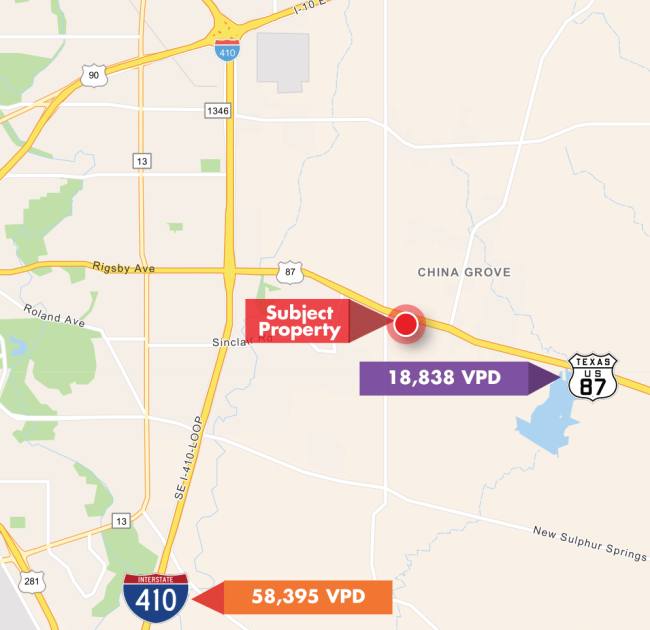
- • Excellent visibility with US Hwy 87 frontage
- • Within a 5-minute drive/2.5 miles of Loop 410
Additional Photos
Listing Agents

Steves Rosser
O: 210-524-4000
M: 210-710-6460
srosser@reocsanantonio.com
O: 210-524-4000
M: 210-710-6460
srosser@reocsanantonio.com
While we strive to provide the most accurate information, all listing information, and demographic data, is provided by third-parties. As such, MyEListing will not be responsible for the accuracy of the information. It is strongly recommended that you verify all information with the listing agent, and any relevant agencies, prior to making any decisions.