Industrial Properties
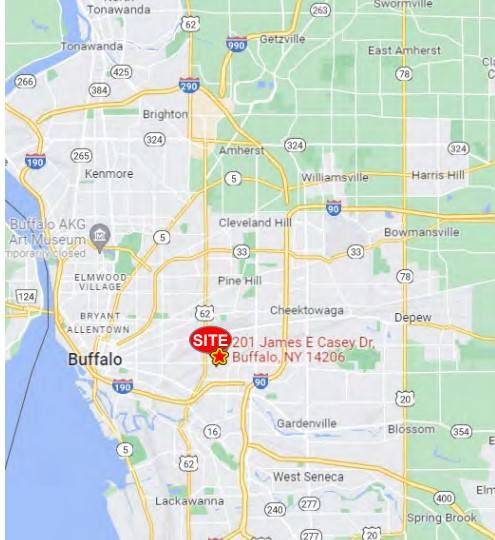
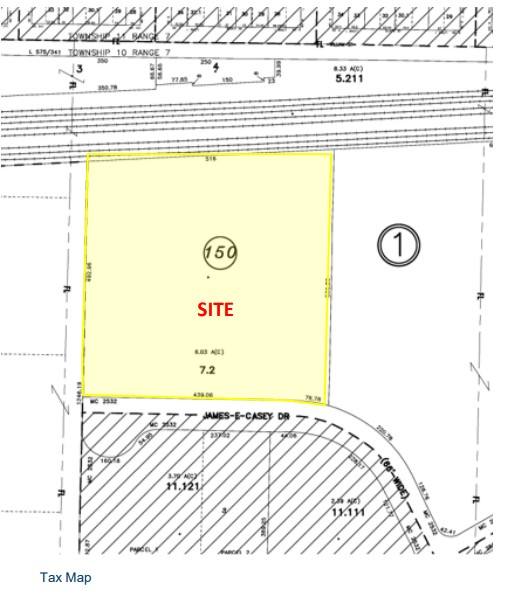
201 James E Casey Drive Buffalo, NY 14206
201 James E Casey Drive Buffalo, NY 14206
Details & Description
Property Highlights
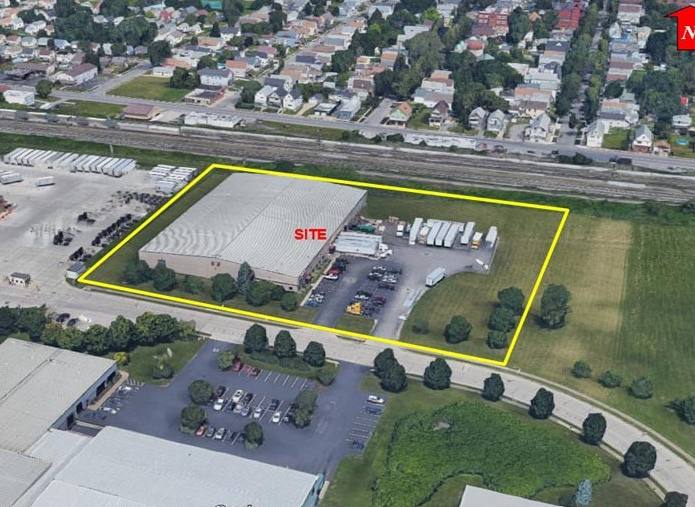
- • 19-25’ clear height
- • Three (3) dock doors
- • One (1) overhead door
- • Additional office space available
- • Central Western New York Location
Listing Agents

Robert Stewart
O: 716-852-7500
M: 716-868-1875
rstewart@pyramidbrokerage.com
O: 716-852-7500
M: 716-868-1875
rstewart@pyramidbrokerage.com

Richard J. Schechter
O: 716-852-7500
M: 716-316-4040
rschechter@pyramidbrokerage.com
O: 716-852-7500
M: 716-316-4040
rschechter@pyramidbrokerage.com
While we strive to provide the most accurate information, all listing information, and demographic data, is provided by third-parties. As such, MyEListing will not be responsible for the accuracy of the information. It is strongly recommended that you verify all information with the listing agent, and any relevant agencies, prior to making any decisions.