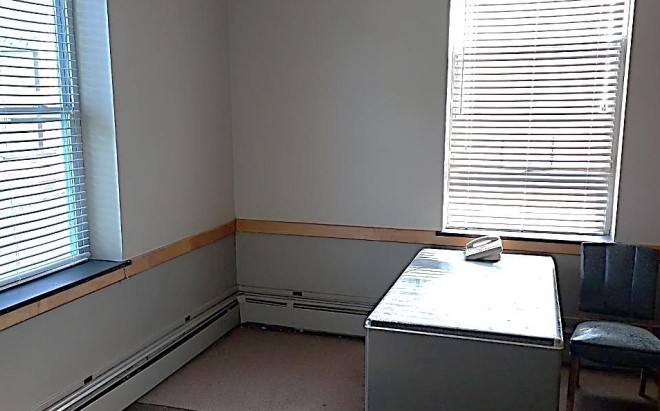
Office Space
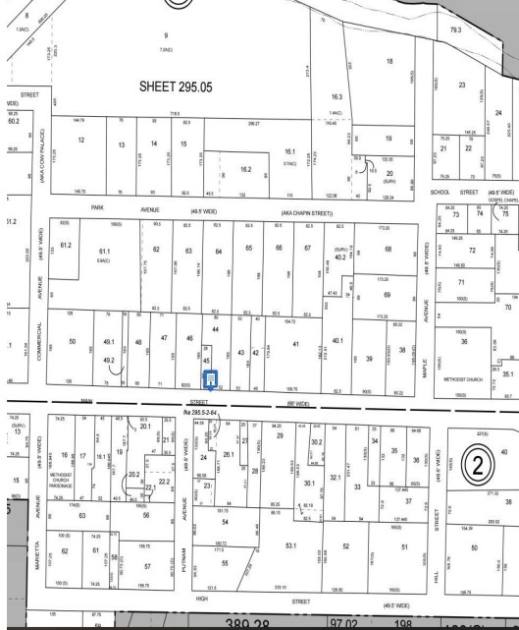
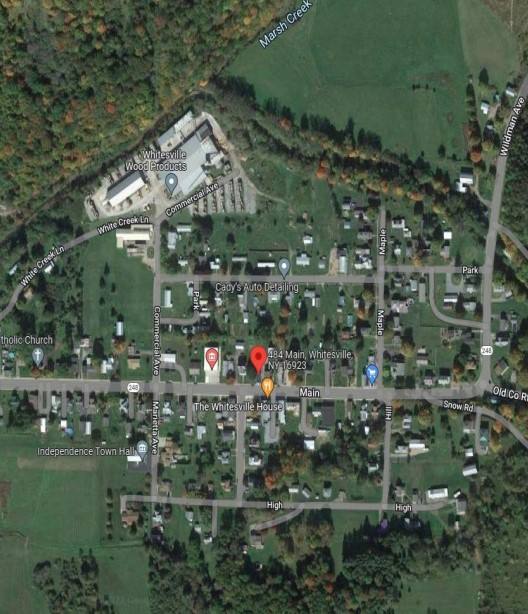
484 Main Street Whitesville, NY 16923
484 Main Street Whitesville, NY 16923
Details & Description
Property Highlights
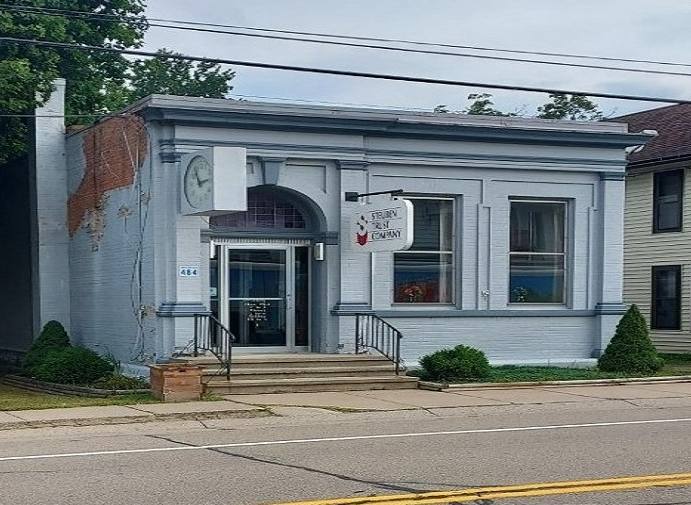
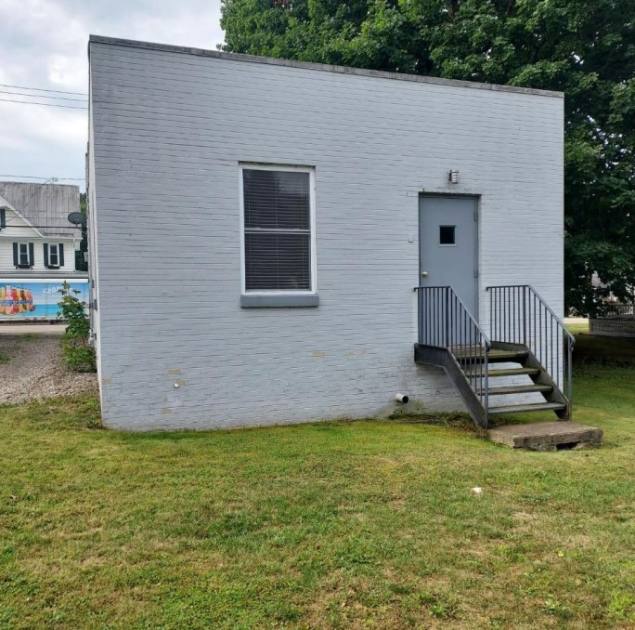
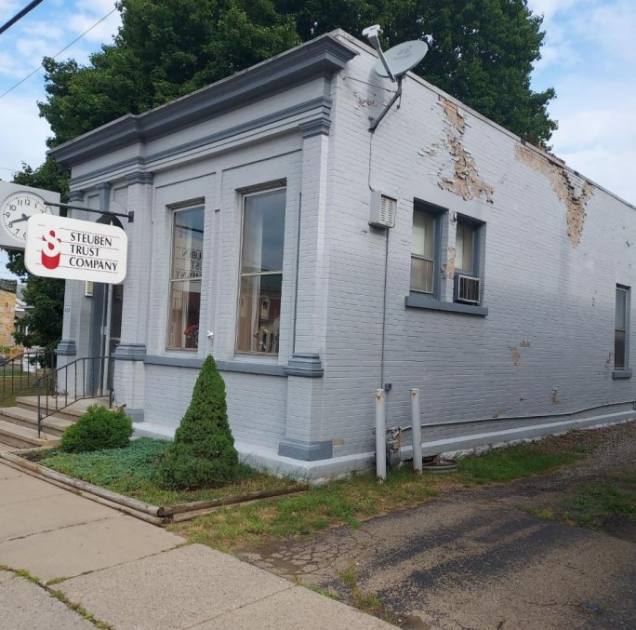
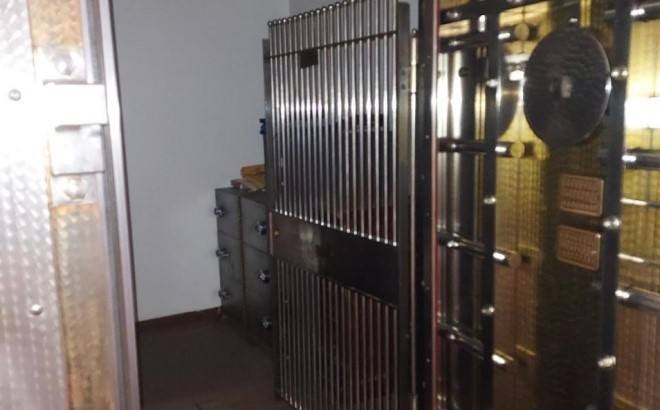
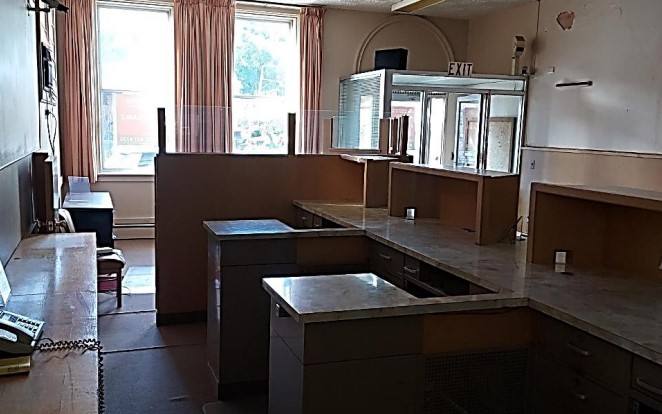
- • Former bank branch built in 1900
- • One story with partial basement
- • No air conditioning
- • Street parking
- • Masonry structure with a flat roof
- • Public water with private septic system
Additional Photos
Listing Agents

Samantha Testani
O: 607-937-9720
M: 607-382-2834
stestani@pyramidbrokerage.com
O: 607-937-9720
M: 607-382-2834
stestani@pyramidbrokerage.com

Joyce M. MacKnight
O: 315-445-8514
M: 315-727-5002
jmacknight@pyramidbrokerage.com
O: 315-445-8514
M: 315-727-5002
jmacknight@pyramidbrokerage.com
While we strive to provide the most accurate information, all listing information, and demographic data, is provided by third-parties. As such, MyEListing will not be responsible for the accuracy of the information. It is strongly recommended that you verify all information with the listing agent, and any relevant agencies, prior to making any decisions.