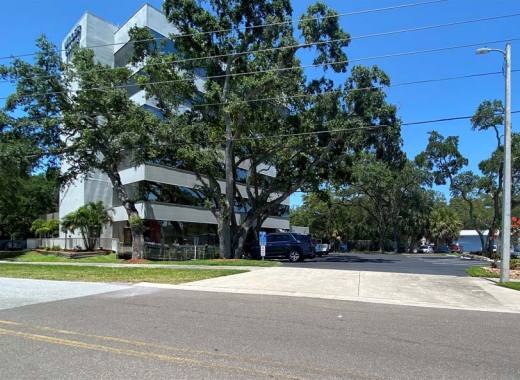
Office Space
3000 Gulf to Bay Boulevard Clearwater, FL 33765
3000 Gulf to Bay Boulevard Clearwater, FL 33765
Details & Description
Property Highlights
- • OFFICE SPACE AVAILABLE
- • FANTASTIC WATER VIEWS AVAILABLE
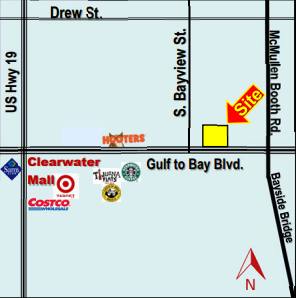
- • DIRECTLY OFF BAYSIDE BRIDGE
- • CLOSE TO MANY EATERIES
- • ACCESS FROM S. BAYVIEW ST. AND DREW ST.
- • 698 SF ?4,627 SF
Listing Agents

Monique Petronje
O: 727-441-1951
moniquepetronje@kleinandheuchan.com
O: 727-441-1951
moniquepetronje@kleinandheuchan.com

Steven Klein
O: 727-441-1951
stevenklein@kleinandheuchan.com
O: 727-441-1951
stevenklein@kleinandheuchan.com
While we strive to provide the most accurate information, all listing information, and demographic data, is provided by third-parties. As such, MyEListing will not be responsible for the accuracy of the information. It is strongly recommended that you verify all information with the listing agent, and any relevant agencies, prior to making any decisions.