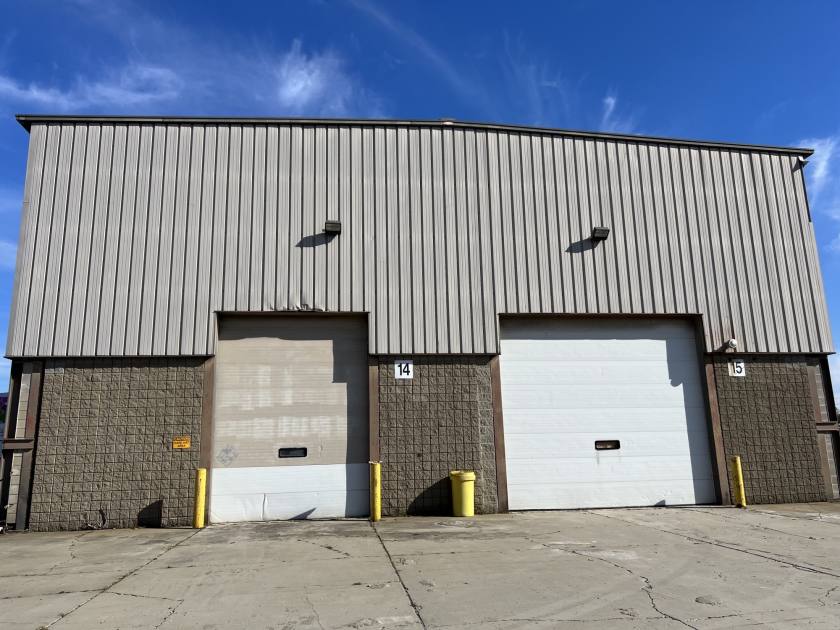
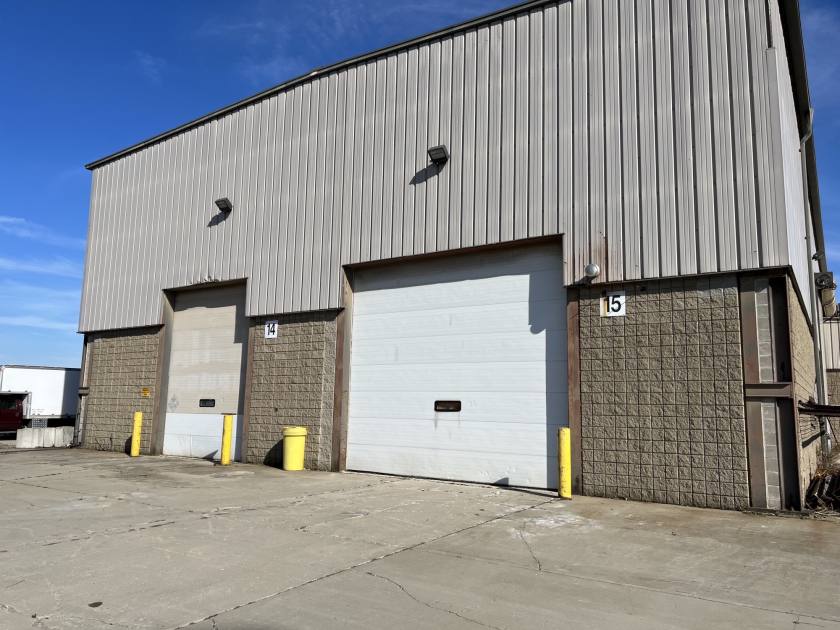
1-Mile | 3-Miles | 5-Miles | ||
---|---|---|---|---|
Total Population | 6,824 | 37,560 | 68,424 | |
Population Median Age | 43 | 43 | 43 | |
Population by Age | 0-9 Yrs | 521 (7%) | 3268 (8%) | 6287 (9%) |
10-19 Yrs | 817 (11%) | 4719 (12%) | 8387 (12%) | |
20-29 Yrs | 845 (12%) | 4204 (11%) | 7281 (10%) | |
30-39 Yrs | 900 (13%) | 4412 (11%) | 8088 (11%) | |
40-49 Yrs | 736 (10%) | 4361 (11%) | 8044 (11%) | |
50-59 Yrs | 1088 (15%) | 5531 (14%) | 10667 (15%) | |
60-69 Yrs | 998 (14%) | 5146 (13%) | 9241 (13%) | |
70+ Yrs | 919 (13%) | 5920 (15%) | 10429 (15%) | |
Median HH Income | $74,380 | $73,100 | $70,113 | |
Total Household Income | < 24K | 340 (11%) | 2411 (14%) | 4842 (16%) |
25-49K | 601 (19%) | 3269 (19%) | 6221 (20%) | |
50-74K | 611 (19%) | 2695 (16%) | 4921 (16%) | |
75-99K | 502 (16%) | 2393 (14%) | 4325 (14%) | |
100-199K | 864 (28%) | 4711 (28%) | 8145 (27%) | |
200K+ | 164 (5%) | 885 (5%) | 1672 (5%) | |
Highest Education Level | No Diploma | 174 | 999 | 2202 |
Diploma or GED | 1103 | 6863 | 14010 | |
Some College | 938 | 4926 | 8861 | |
Assoc. Degree | 903 | 4294 | 7688 | |
Bachelors Degree | 1260 | 5968 | 10402 | |
Higher Degree | 665 | 4364 | 7157 | |
Total Housing Units | 3,191 | 17,180 | 31,410 | |
--Owner-Occupied | 2,180 | 11,857 | 21,593 | |
--Renter-Occupied | 902 | 4,507 | 8,532 | |
Owner-Occupied Values | < 100K | 175 | 1305 | 2456 |
100-199K | 1262 | 5516 | 10530 | |
200-299K | 639 | 3654 | 5654 | |
300-399K | 80 | 1040 | 2009 | |
400-499K | 6 | 172 | 572 | |
500K+ | 19 | 171 | 373 | |
Total Working Age Population | 5,815 | 31,269 | 56,794 | |
In Work Force | 3,881 | 20,188 | 36,859 | |
Not In Work Force | 1,934 | 11,081 | 19,935 | |
Workforce Employed | 3,840 | 19,689 | 35,521 | |
Workforce Unemployed | 16 | 447 | 1,276 | |
Civlian Workforce | 3,856 | 20,137 | 36,797 | |
Military Workforce | 25 | 51 | 61 | |
Total Households | 3,083 | 16,364 | 30,125 | |
Family Households | 1,796 | 10,095 | 18,313 | |
Non-Family Households | 1,286 | 6,269 | 11,812 | |
Married Couple | 1,352 | 7,791 | 13,950 | |
Other Family | 445 | 2,304 | 4,363 | |
Married w/Child | 525 | 2,757 | 4,848 | |
Single Male w/Child | 47 | 401 | 755 | |
Single Female w/Child | 144 | 811 | 1,527 |
Population Change Last Two Decades - Plus Projection
2000 | % | 2010 | % | 2020 | % | 2030 | |
---|---|---|---|---|---|---|---|
New York | 18,976,457 | +2 | 19,378,102 | +4 | 20,146,131 | +2 | 20,604,030 |
Erie County | 950,265 | -3 | 919,040 | +2 | 936,084 | +1 | 949,073 |
Total Working Age Population:
Total Households:
Total Working Age Population:
Total Households:
Total Working Age Population:
Total Households: