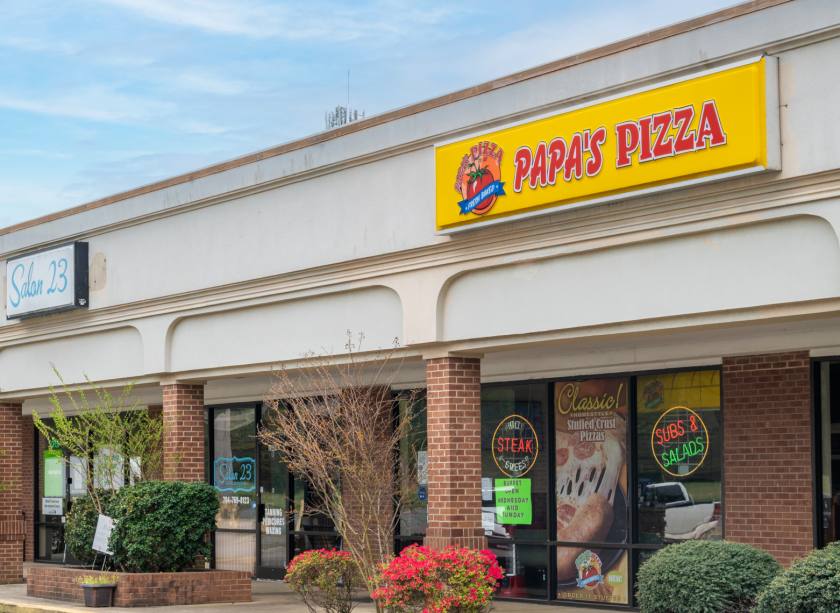
Retail Space
1002-1012 E Main St Cherryville, NC 28021
1002-1012 E Main St Cherryville, NC 28021
Details & Description
Property Highlights
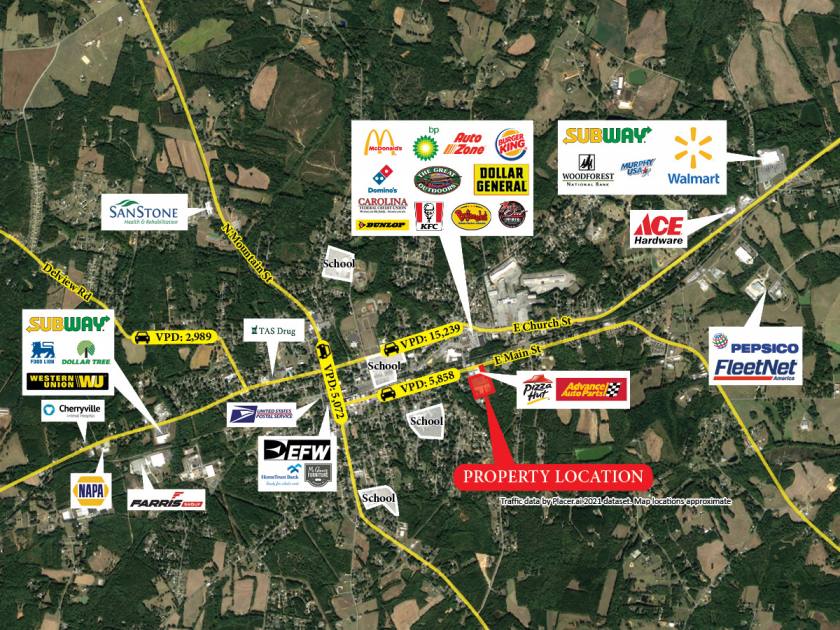
- • Charlotte Metropolitan Area
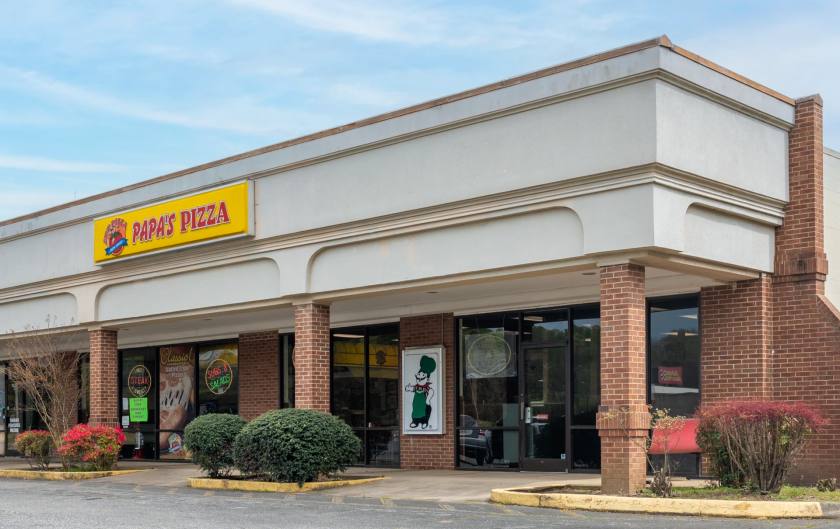
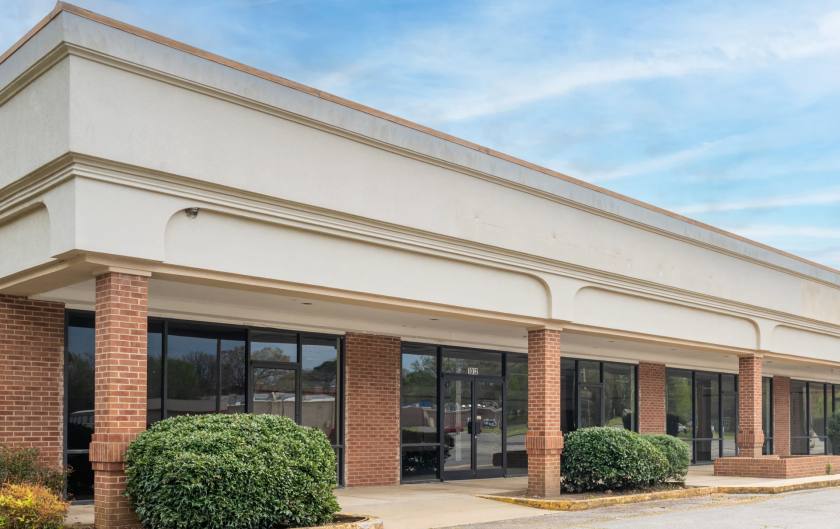
- • Large Parking Field
- • Great Visibility & Access
Additional Photos

Listing Agents

Taylor Marks
O: 817-927-0050
tmarks-leads@woodcrestcapital.com
O: 817-927-0050
tmarks-leads@woodcrestcapital.com
While we strive to provide the most accurate information, all listing information, and demographic data, is provided by third-parties. As such, MyEListing will not be responsible for the accuracy of the information. It is strongly recommended that you verify all information with the listing agent, and any relevant agencies, prior to making any decisions.


