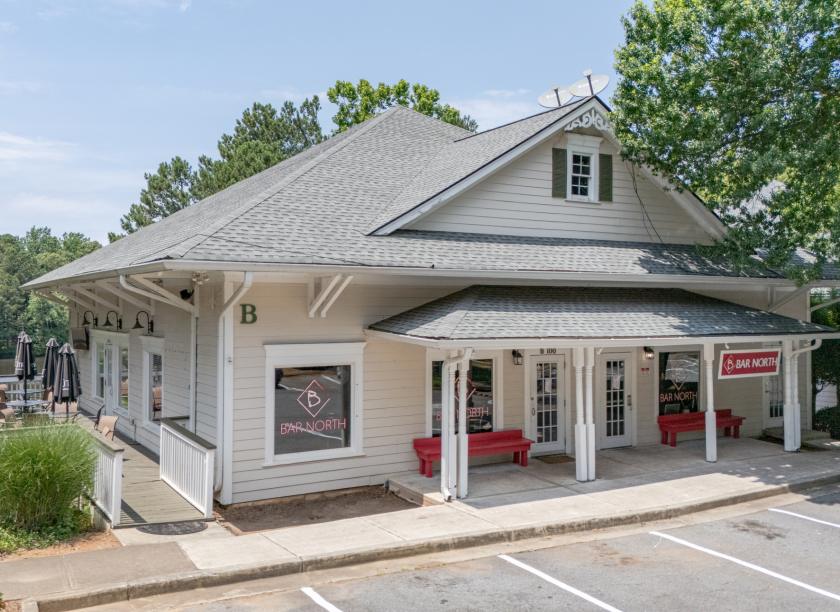
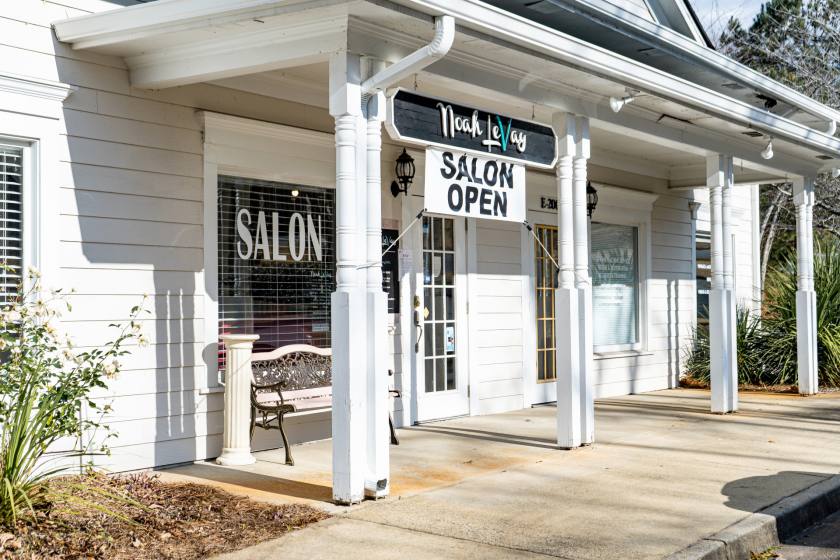
1-Mile | 3-Miles | 5-Miles | ||
---|---|---|---|---|
Total Population | 12,235 | 77,431 | 167,397 | |
Population Median Age | 35 | 36 | 36 | |
Population by Age | 0-9 Yrs | 1491 (12%) | 8634 (11%) | 19903 (11%) |
10-19 Yrs | 2051 (16%) | 12533 (16%) | 25914 (15%) | |
20-29 Yrs | 2203 (18%) | 13535 (17%) | 28127 (16%) | |
30-39 Yrs | 1380 (11%) | 9491 (12%) | 22480 (13%) | |
40-49 Yrs | 1901 (15%) | 11426 (14%) | 22715 (13%) | |
50-59 Yrs | 1565 (12%) | 10442 (13%) | 22266 (13%) | |
60-69 Yrs | 958 (7%) | 6909 (8%) | 15522 (9%) | |
70+ Yrs | 685 (5%) | 4461 (5%) | 10470 (6%) | |
Median HH Income | $85,612 | $75,151 | $76,962 | |
Total Household Income | < 24K | 456 (10%) | 3715 (13%) | 7662 (12%) |
25-49K | 817 (19%) | 5435 (19%) | 10941 (18%) | |
50-74K | 508 (11%) | 4600 (16%) | 10430 (17%) | |
75-99K | 829 (19%) | 4342 (15%) | 9078 (15%) | |
100-199K | 1196 (28%) | 7626 (27%) | 17157 (28%) | |
200K+ | 458 (10%) | 1835 (6%) | 4224 (7%) | |
Highest Education Level | No Diploma | 357 | 3474 | 7392 |
Diploma or GED | 1261 | 10640 | 22743 | |
Some College | 1360 | 10328 | 22435 | |
Assoc. Degree | 698 | 4147 | 8455 | |
Bachelors Degree | 2647 | 13897 | 30722 | |
Higher Degree | 1296 | 5905 | 14538 | |
Total Housing Units | 4,330 | 29,040 | 62,679 | |
--Owner-Occupied | 3,257 | 18,761 | 39,626 | |
--Renter-Occupied | 1,006 | 8,793 | 19,867 | |
Owner-Occupied Values | < 100K | 31 | 691 | 1298 |
100-199K | 1071 | 7313 | 14386 | |
200-299K | 1379 | 7713 | 14418 | |
300-399K | 512 | 2121 | 5802 | |
400-499K | 231 | 573 | 1636 | |
500K+ | 33 | 350 | 2086 | |
Total Working Age Population | 9,502 | 62,039 | 133,562 | |
In Work Force | 7,029 | 44,266 | 93,816 | |
Not In Work Force | 2,473 | 17,773 | 39,746 | |
Workforce Employed | 6,743 | 41,924 | 89,440 | |
Workforce Unemployed | 286 | 2,217 | 4,057 | |
Civlian Workforce | 7,029 | 44,141 | 93,497 | |
Military Workforce | 0 | 124 | 319 | |
Total Households | 4,264 | 27,554 | 59,493 | |
Family Households | 3,166 | 19,109 | 41,160 | |
Non-Family Households | 1,098 | 8,444 | 18,333 | |
Married Couple | 2,502 | 14,315 | 31,570 | |
Other Family | 664 | 4,794 | 9,590 | |
Married w/Child | 1,472 | 7,236 | 14,891 | |
Single Male w/Child | 53 | 407 | 1,065 | |
Single Female w/Child | 400 | 1,904 | 3,843 |
Population Change Last Two Decades - Plus Projection
2000 | % | 2010 | % | 2020 | % | 2030 | |
---|---|---|---|---|---|---|---|
Georgia | 8,186,453 | +18 | 9,687,653 | +12 | 10,833,472 | +13 | 12,292,423 |
Bartow County | 76,019 | +32 | 100,157 | +11 | 110,771 | +18 | 130,468 |
Cobb County | 607,751 | +13 | 688,078 | +15 | 790,588 | +19 | 938,747 |
Cherokee County | 141,903 | +51 | 214,346 | +24 | 266,617 | +20 | 320,849 |
Total Working Age Population:
Total Households:
Total Working Age Population:
Total Households:
Total Working Age Population:
Total Households: