Specialty Real Estate
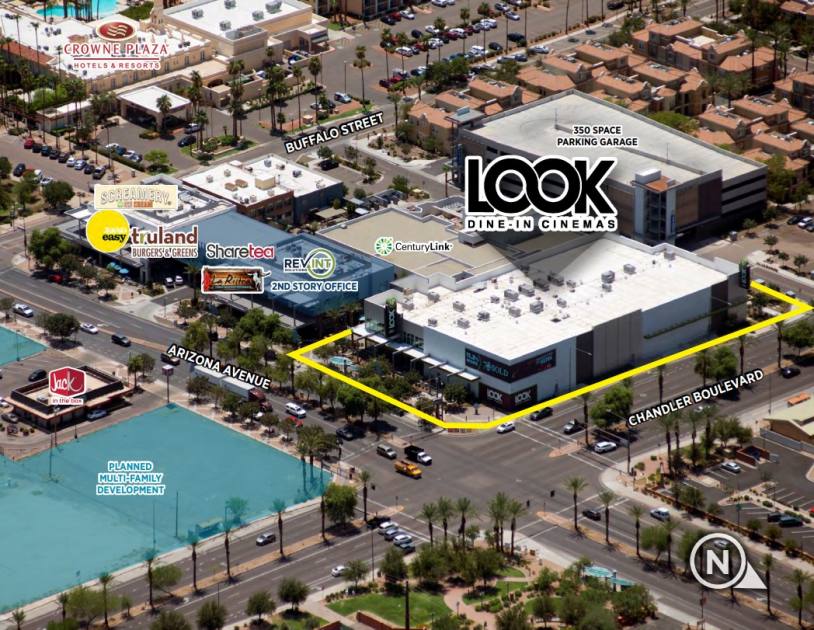
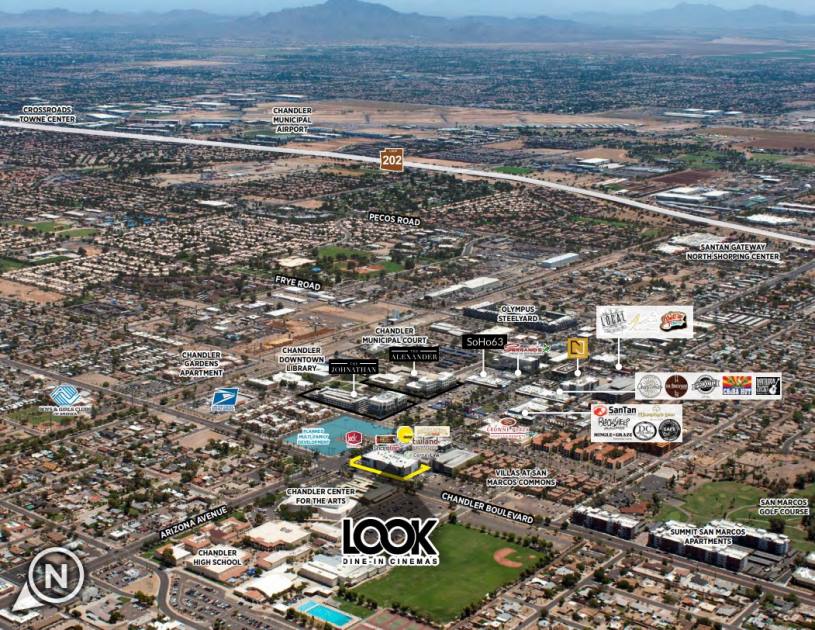
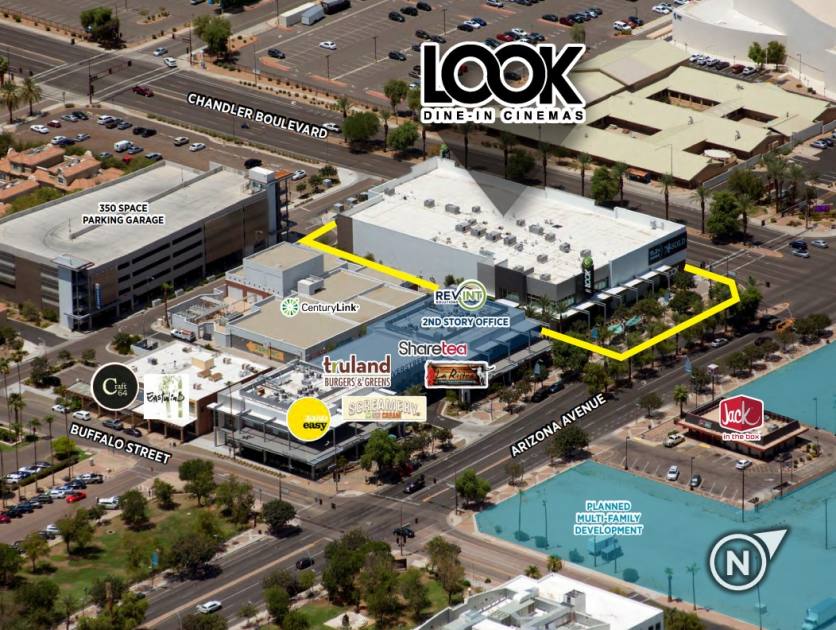
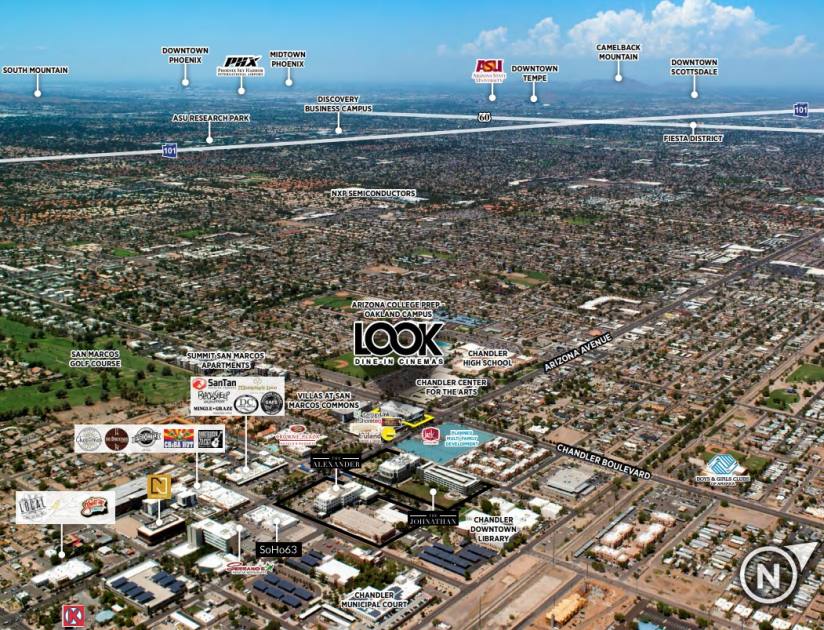
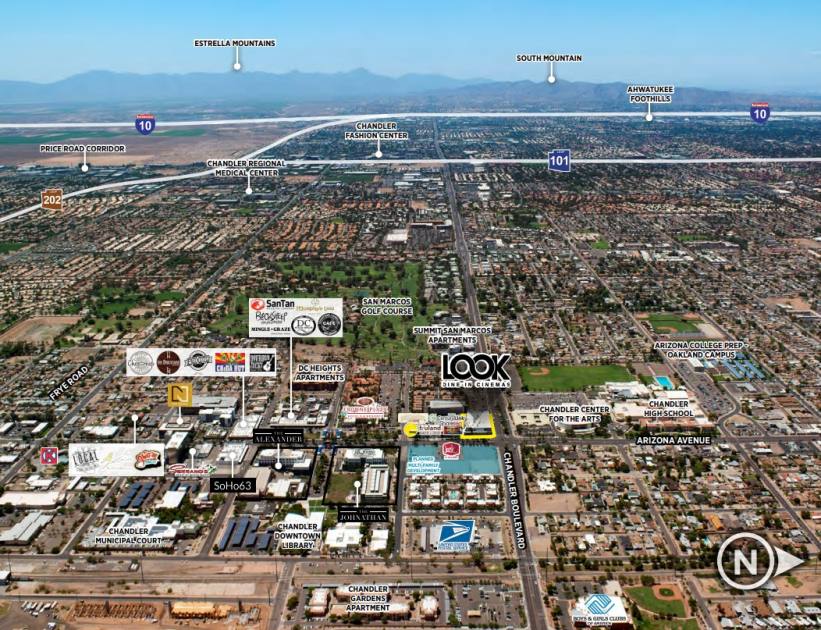
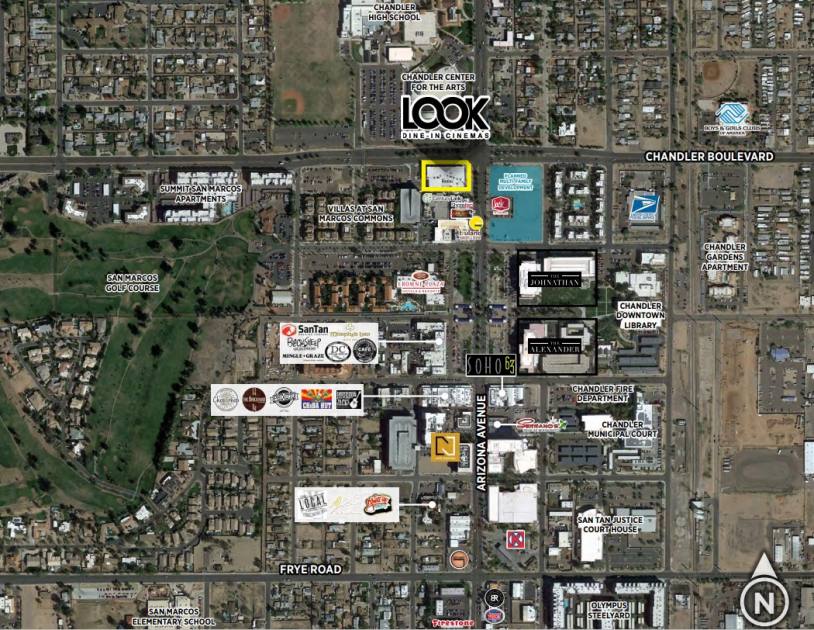
1 West Chandler Boulevard Chandler, AZ 85225
1 West Chandler Boulevard Chandler, AZ 85225
Details & Description
Property Highlights
- • Located in an Opportunity Zone
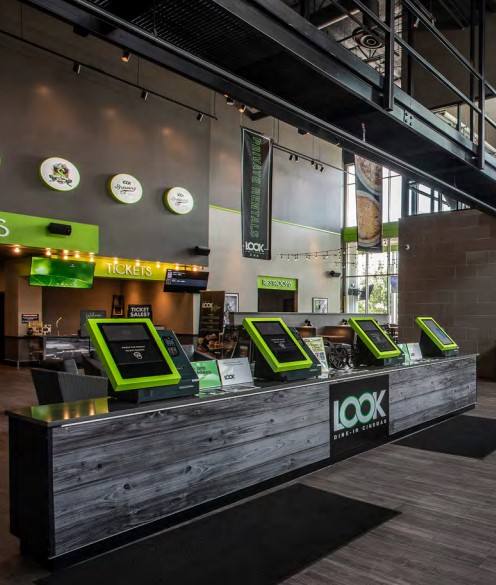
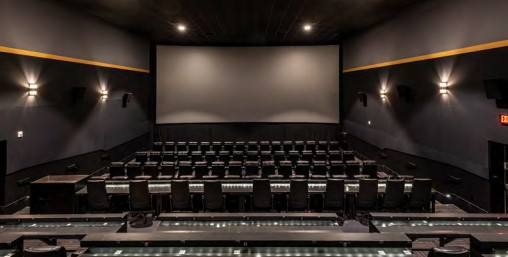
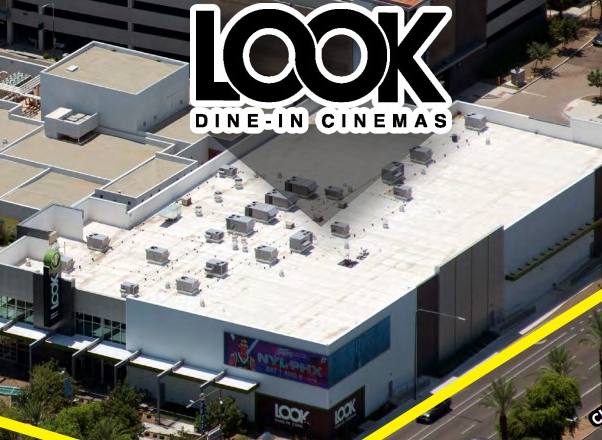
- • 9 screen theater with over 1,000 seats
- • 12 unit operator of dine-in theaters
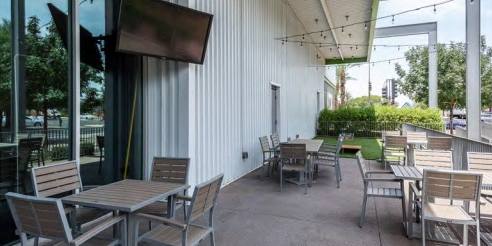
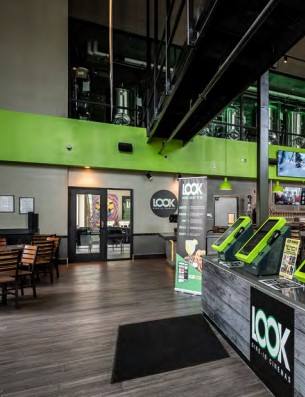
Additional Photos


Listing Agents

Chris Hollenbeck
O: 602-224-4475
chris.hollenbeck@cushwake.com
O: 602-224-4475
chris.hollenbeck@cushwake.com

Shane Carter
Cushman and Wakefield
O: 602-224-4442
shane.carter@cushwake.com
Cushman and Wakefield
O: 602-224-4442
shane.carter@cushwake.com
While we strive to provide the most accurate information, all listing information, and demographic data, is provided by third-parties. As such, MyEListing will not be responsible for the accuracy of the information. It is strongly recommended that you verify all information with the listing agent, and any relevant agencies, prior to making any decisions.