Retail Space
854 East Williams Field Road Gilbert, AZ 85295
854 East Williams Field Road Gilbert, AZ 85295

Details & Description
Property Highlights
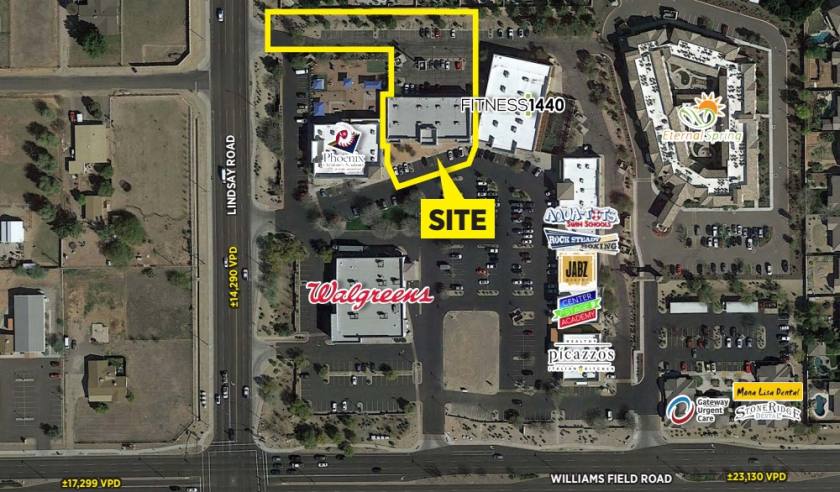
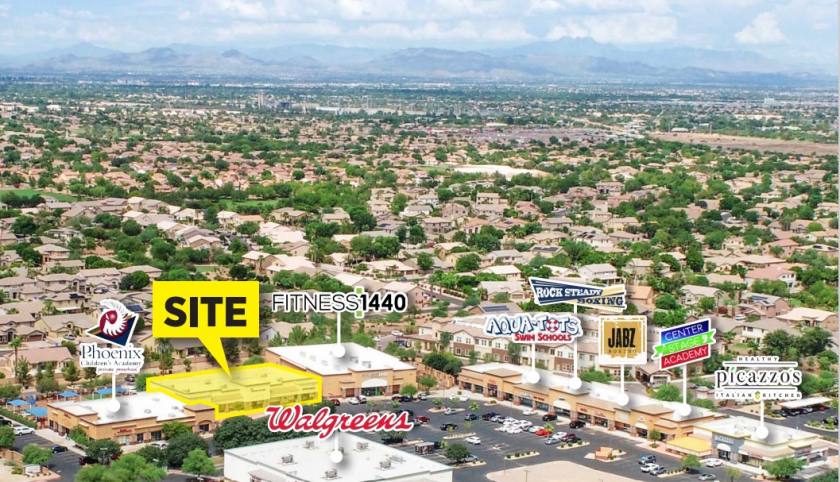
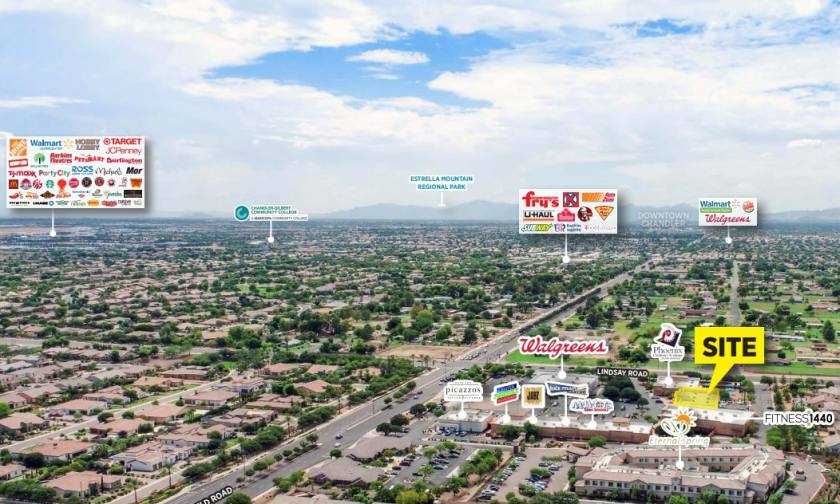
• Co-tenants with Walgreens, Phoenix Children’s Academy, Fitness 1440, and more
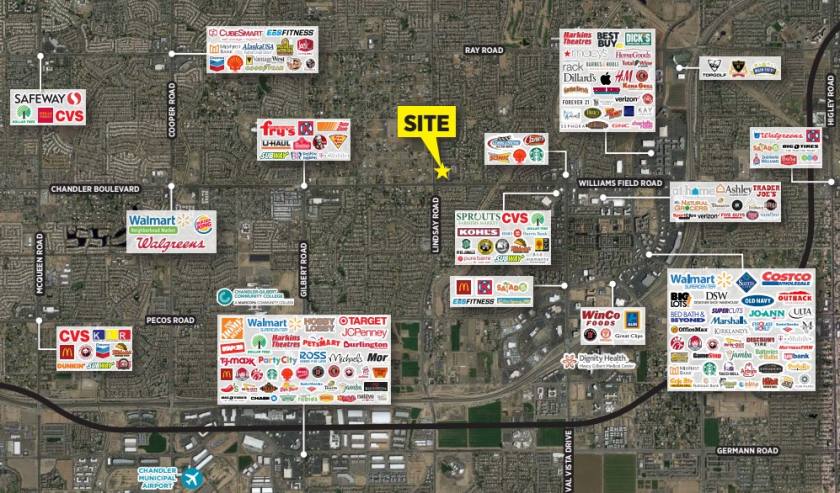
• Densely populated trade area with over 329,000 residents in a 5-mile radius
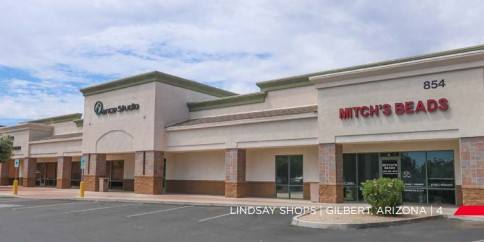
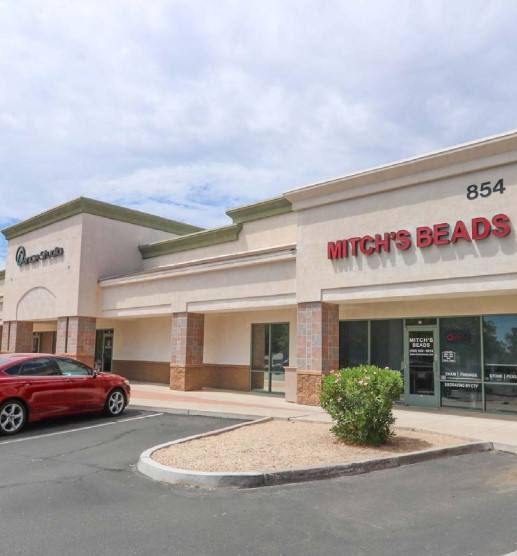
Additional Photos
Listing Agents

Chris Hollenbeck
O: 602-224-4475
chris.hollenbeck@cushwake.com
O: 602-224-4475
chris.hollenbeck@cushwake.com

Shane Carter
Cushman and Wakefield
O: 602-224-4442
shane.carter@cushwake.com
Cushman and Wakefield
O: 602-224-4442
shane.carter@cushwake.com
While we strive to provide the most accurate information, all listing information, and demographic data, is provided by third-parties. As such, MyEListing will not be responsible for the accuracy of the information. It is strongly recommended that you verify all information with the listing agent, and any relevant agencies, prior to making any decisions.