Specialty Real Estate
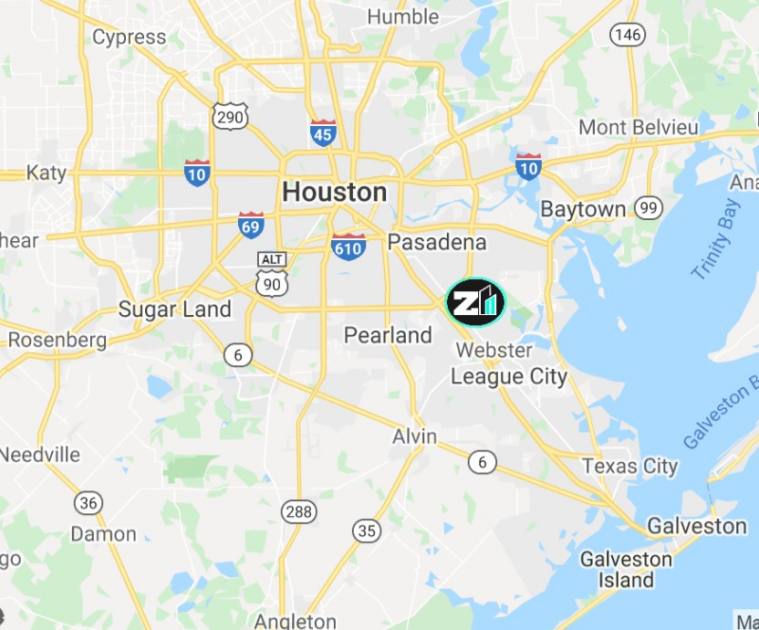
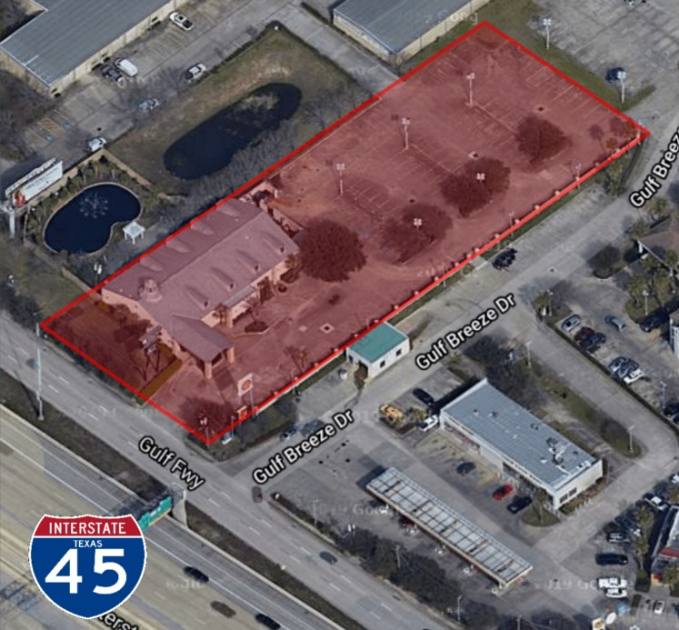
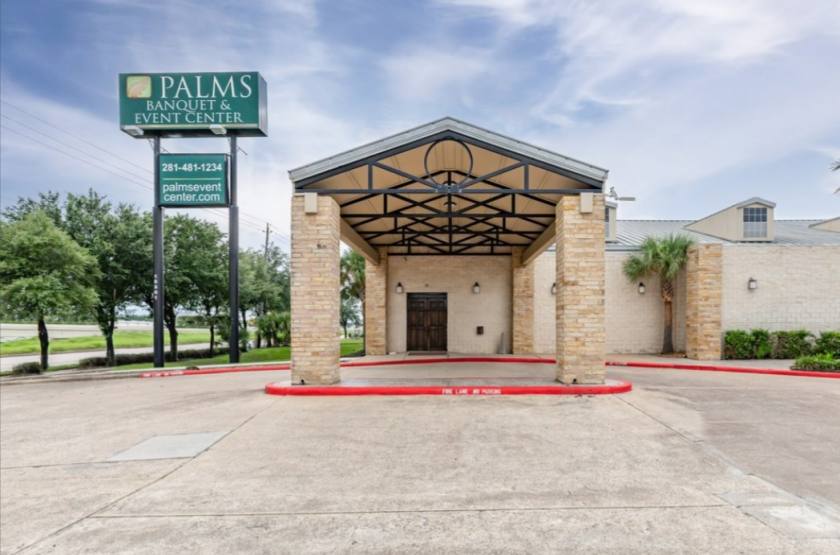
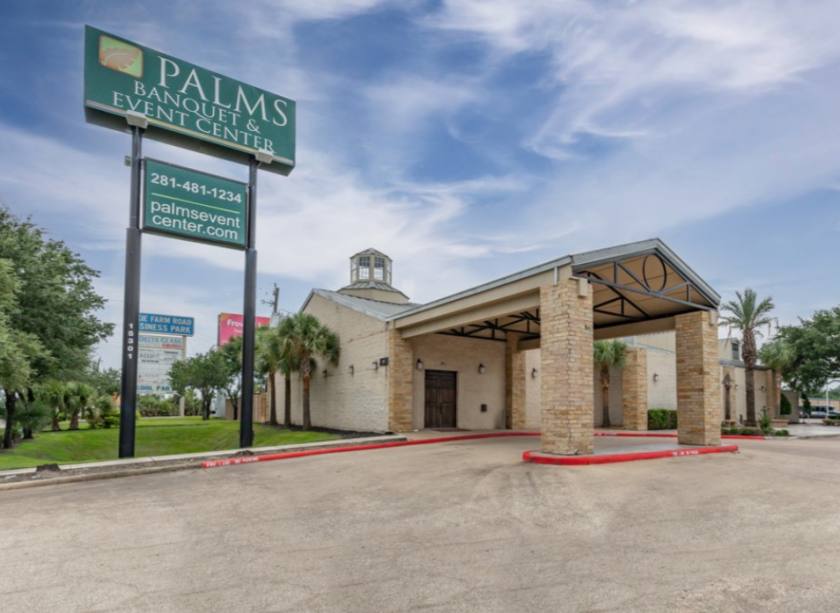
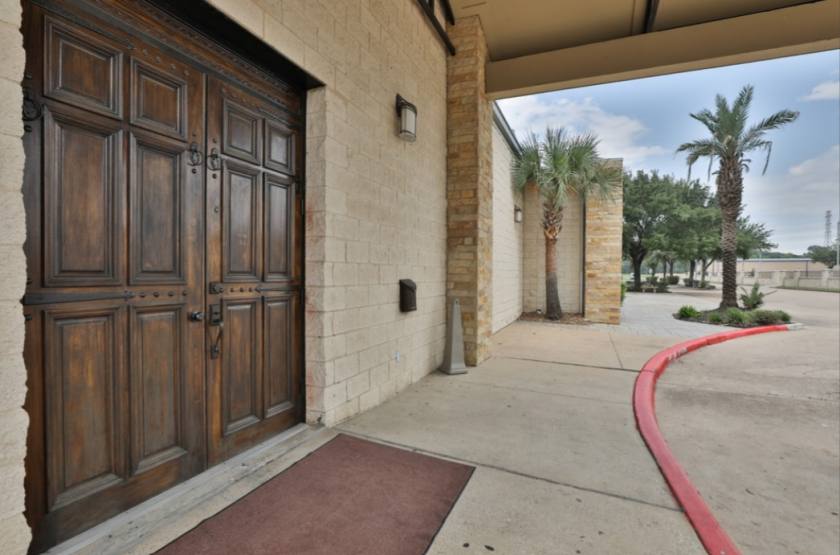
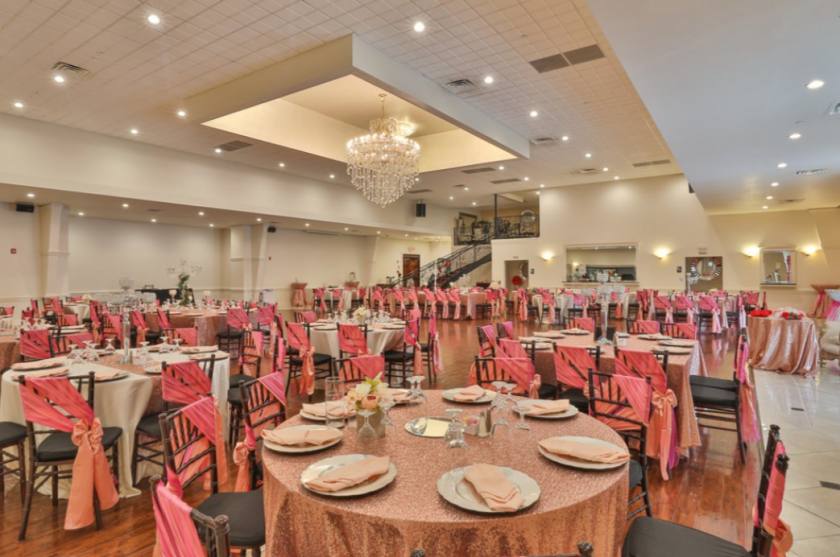
15301 Gulf Freeway Houston, TX 77034
15301 Gulf Freeway Houston, TX 77034
Details & Description
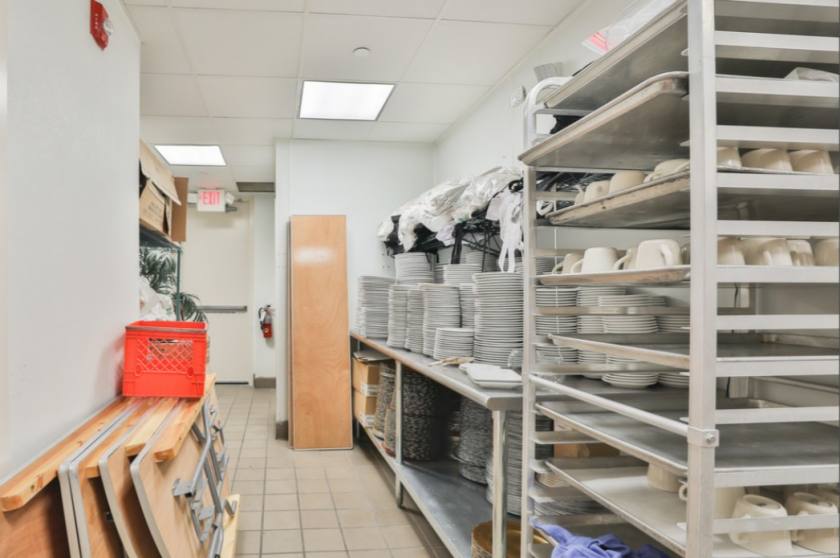
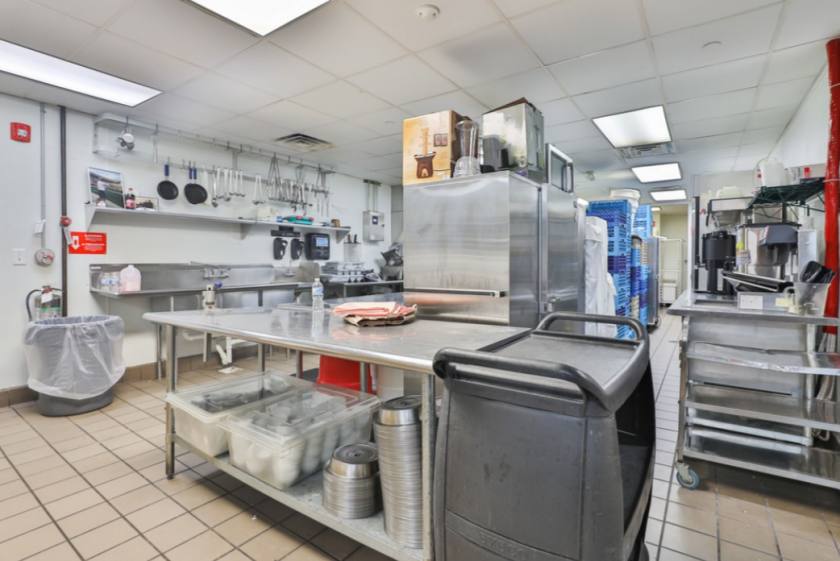
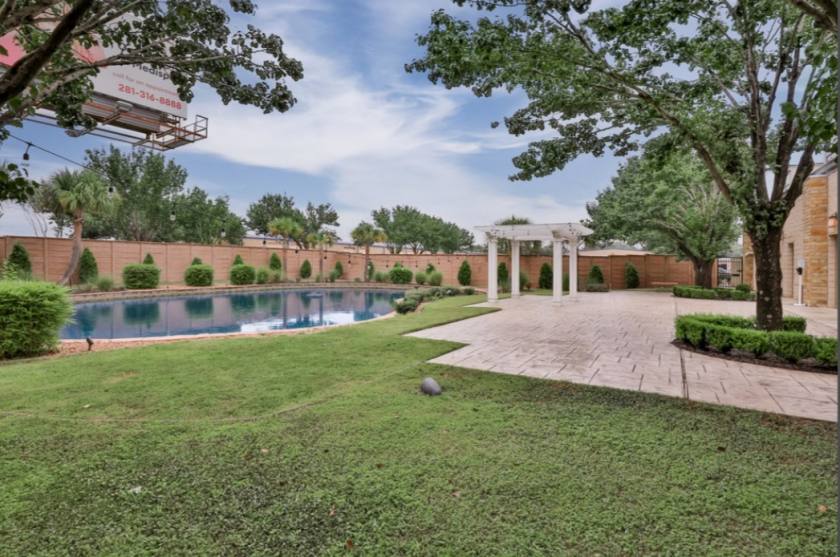
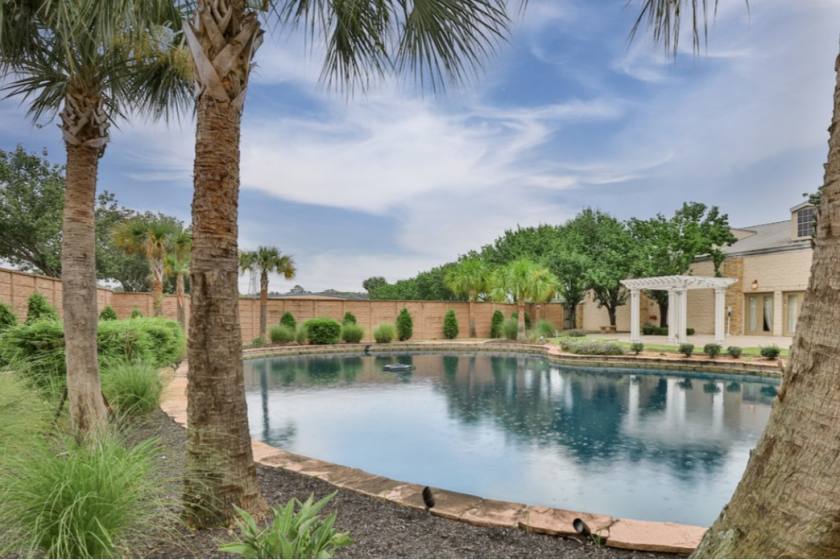
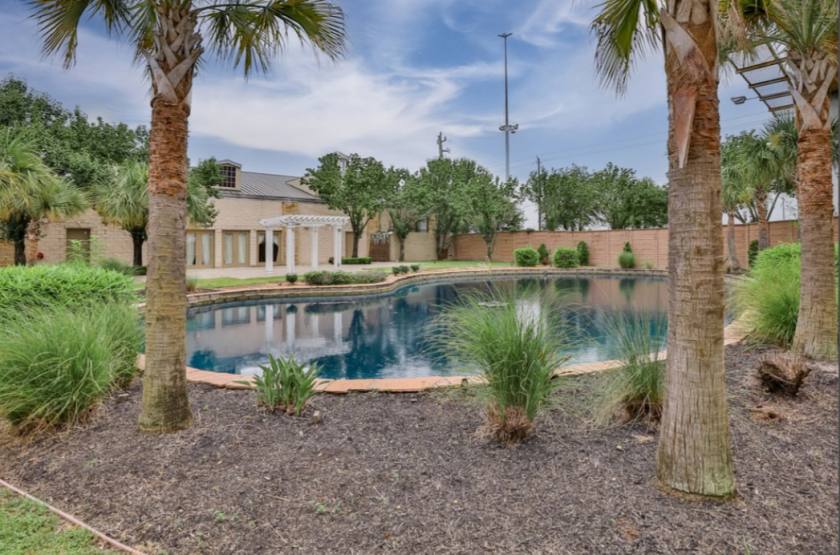
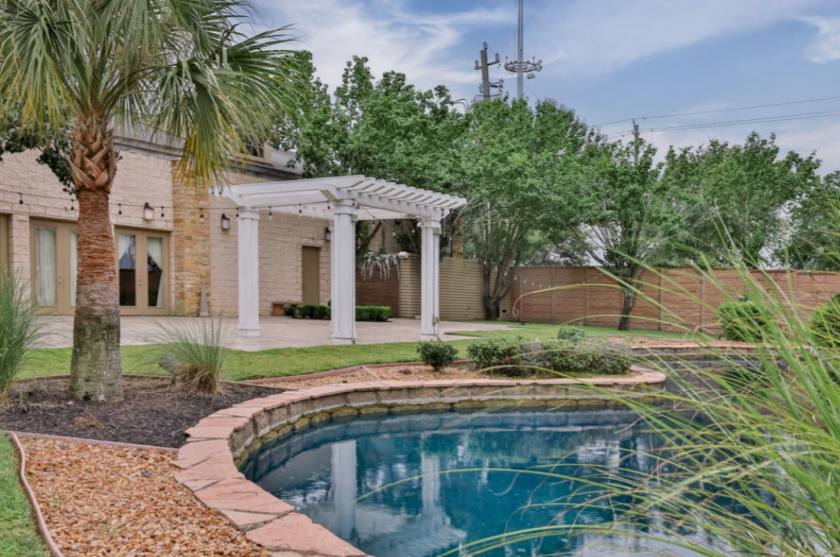
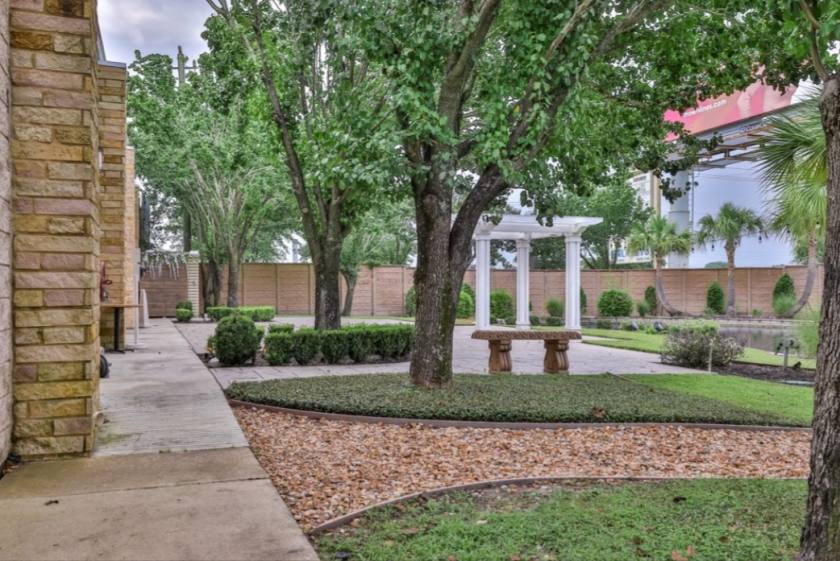
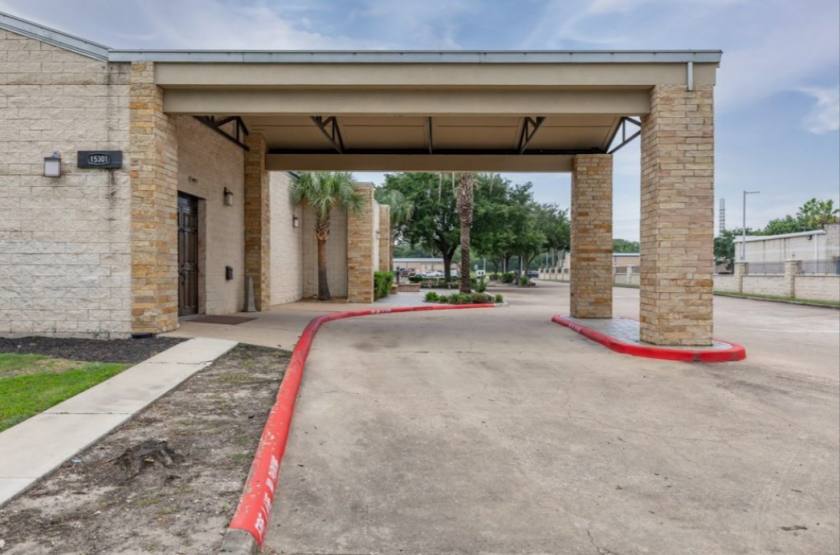
Additional Photos

Listing Agents

Jason C. Kieschnick
O: 832-915-1827
M: 832-689-0105
jkieschnick@zann.com
O: 832-915-1827
M: 832-689-0105
jkieschnick@zann.com

Derek Hughes
O: 832-915-2637
M: 713-204-0268
dhughes@zann.com
O: 832-915-2637
M: 713-204-0268
dhughes@zann.com
While we strive to provide the most accurate information, all listing information, and demographic data, is provided by third-parties. As such, MyEListing will not be responsible for the accuracy of the information. It is strongly recommended that you verify all information with the listing agent, and any relevant agencies, prior to making any decisions.