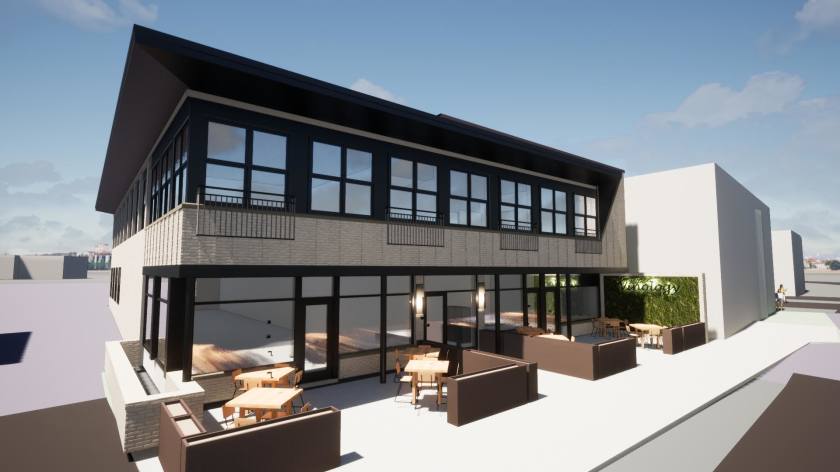
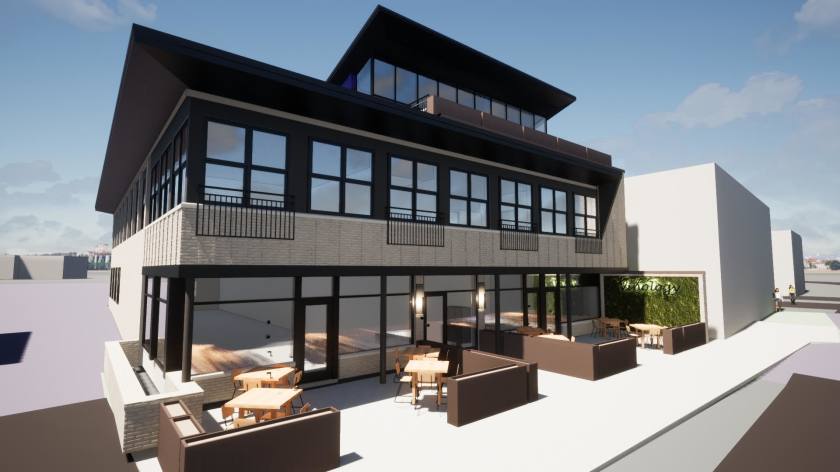
1-Mile | 3-Miles | 5-Miles | ||
---|---|---|---|---|
Total Population | 12,645 | 86,631 | 258,051 | |
Population Median Age | 37 | 37 | 38 | |
Population by Age | 0-9 Yrs | 1429 (11%) | 8674 (10%) | 27129 (10%) |
10-19 Yrs | 1118 (8%) | 9576 (11%) | 31407 (12%) | |
20-29 Yrs | 2552 (20%) | 18518 (21%) | 50095 (19%) | |
30-39 Yrs | 2238 (17%) | 13914 (16%) | 37977 (14%) | |
40-49 Yrs | 1679 (13%) | 10086 (11%) | 28620 (11%) | |
50-59 Yrs | 1435 (11%) | 9266 (10%) | 31517 (12%) | |
60-69 Yrs | 1205 (9%) | 9234 (10%) | 27877 (10%) | |
70+ Yrs | 988 (7%) | 7363 (8%) | 23429 (9%) | |
Median HH Income | $114,330 | $67,705 | $57,042 | |
Total Household Income | < 24K | 466 (7%) | 6818 (16%) | 27599 (23%) |
25-49K | 843 (13%) | 8469 (20%) | 24940 (21%) | |
50-74K | 794 (12%) | 6646 (16%) | 18405 (15%) | |
75-99K | 672 (10%) | 4448 (11%) | 12390 (10%) | |
100-199K | 1845 (30%) | 9277 (22%) | 23241 (19%) | |
200K+ | 1526 (24%) | 4752 (11%) | 10544 (9%) | |
Highest Education Level | No Diploma | 47 | 3523 | 14826 |
Diploma or GED | 428 | 10508 | 35834 | |
Some College | 605 | 8669 | 29278 | |
Assoc. Degree | 495 | 3831 | 12546 | |
Bachelors Degree | 3871 | 19564 | 49026 | |
Higher Degree | 3769 | 15181 | 35157 | |
Total Housing Units | 6,451 | 44,953 | 132,553 | |
--Owner-Occupied | 3,906 | 21,415 | 59,238 | |
--Renter-Occupied | 2,240 | 18,994 | 57,881 | |
Owner-Occupied Values | < 100K | 36 | 2804 | 9871 |
100-199K | 126 | 5537 | 19871 | |
200-299K | 782 | 4942 | 11472 | |
300-399K | 838 | 3017 | 7330 | |
400-499K | 683 | 1644 | 3683 | |
500K+ | 1441 | 3472 | 7012 | |
Total Working Age Population | 10,470 | 72,931 | 215,300 | |
In Work Force | 8,470 | 52,601 | 145,449 | |
Not In Work Force | 2,000 | 20,331 | 69,851 | |
Workforce Employed | 8,365 | 50,663 | 137,849 | |
Workforce Unemployed | 105 | 1,873 | 7,463 | |
Civlian Workforce | 8,470 | 52,536 | 145,312 | |
Military Workforce | 0 | 64 | 137 | |
Total Households | 6,146 | 40,409 | 117,119 | |
Family Households | 3,088 | 18,837 | 55,407 | |
Non-Family Households | 3,059 | 21,572 | 61,712 | |
Married Couple | 2,478 | 13,730 | 37,683 | |
Other Family | 609 | 5,107 | 17,724 | |
Married w/Child | 1,040 | 5,386 | 14,821 | |
Single Male w/Child | 66 | 440 | 1,588 | |
Single Female w/Child | 228 | 2,159 | 7,588 |
Population Change Last Two Decades - Plus Projection
2000 | % | 2010 | % | 2020 | % | 2030 | |
---|---|---|---|---|---|---|---|
Kentucky | 4,041,769 | +7 | 4,339,367 | +4 | 4,533,464 | +4 | 4,726,382 |
Kenton County | 151,464 | +5 | 159,720 | +6 | 169,386 | +4 | 176,039 |
Campbell County | 88,616 | +2 | 90,336 | +3 | 92,898 | +1 | 93,473 |
Ohio | 11,353,140 | +2 | 11,536,504 | 0 | 11,574,870 | 0 | 11,615,100 |
Hamilton County | 845,303 | -5 | 802,374 | -1 | 790,600 | -1 | 785,900 |
Total Working Age Population:
Total Households:
Total Working Age Population:
Total Households:
Total Working Age Population:
Total Households: