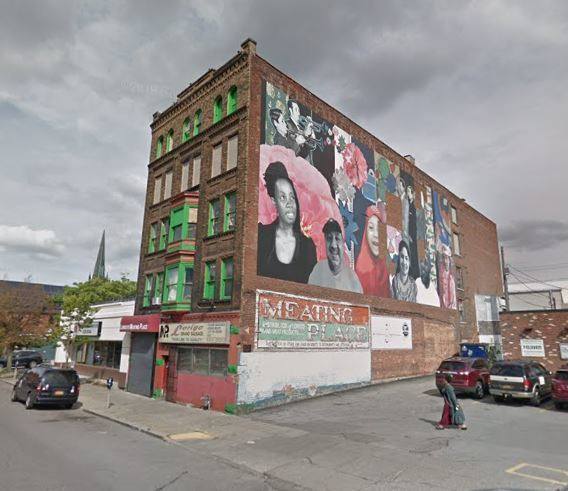
New York is pleased to present a rare opportunity to acquire a landmark property and former convenience store, deli & grocery business in the heart of the up and coming West Side of Buffalo. Former Lorigo's Meating Place was one of Buffalo's top meat distributors, formerly served a large number of WNY restaurants. 5-story mixed-use building available for Sale or Lease. Building consisting of 28,560 +/- SF mixed-use building. This 5 story warehouse & retail space is also accessible from Auburn Avenue. This former Grocery/Meat/Deli Store located on the first floor of the five (5) story building has one (1) 8' grade level door. Ceiling heights: 12'. Ideal for: distribution, multi-unit / mixed-use redevelopment. Building formerly had a USDA Certified Meat processing facility.Located on Grant Street in Buffalo's revitalized West Side just south of Sweet_ness 7 Café. The area, between Richmond Avenue and Niagara Street, has seen multiple new multi-family redevelopments in recent years. Potential to redevelop building into market-rate loft-style apartments. This property is west of Elmwood Village with easy access to New York State Thruway I-990. Minutes from Downtown Buffalo and the Canadian / United States border. New $50 Million movie/film production facility being built within a three minute drive to the west of the property as well as a constructed three-story building with nine apartments and a single ground floor commercial space at 386 Grant Street. Bustling with foot traffic. The property is in very close vicinity to Buffalo State University, The Albright-Knox Art Gallery the new UB Medical campus, Niagara Street-Rich Products Corporation, and Elmwood Avenue.