Commercial Land
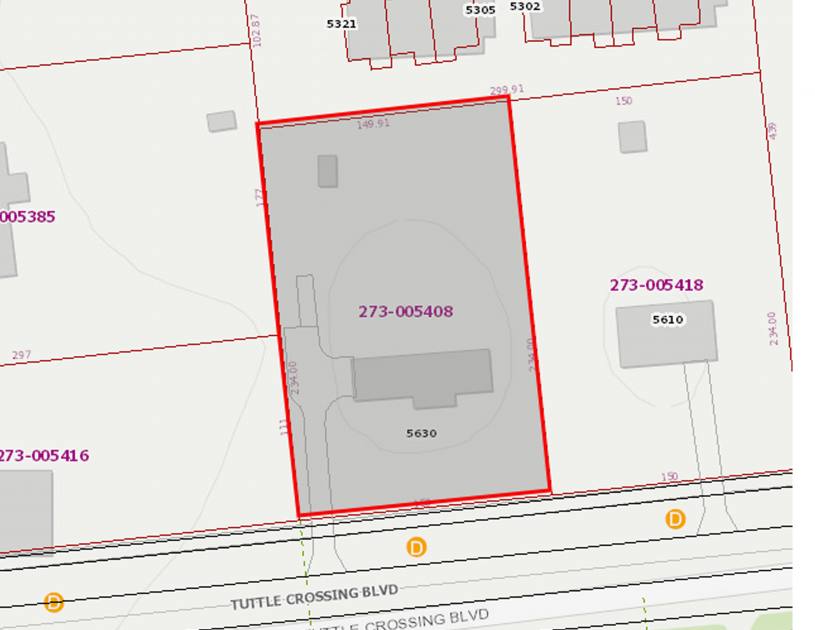
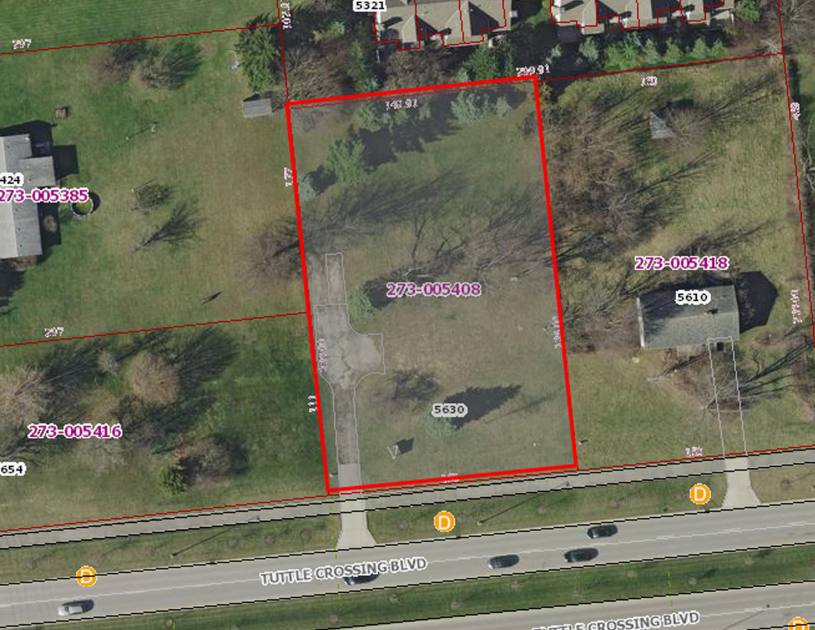
5630 Tuttle Crossing Boulevard Dublin, OH 43016
5630 Tuttle Crossing Boulevard Dublin, OH 43016
Details & Description
Property Highlights
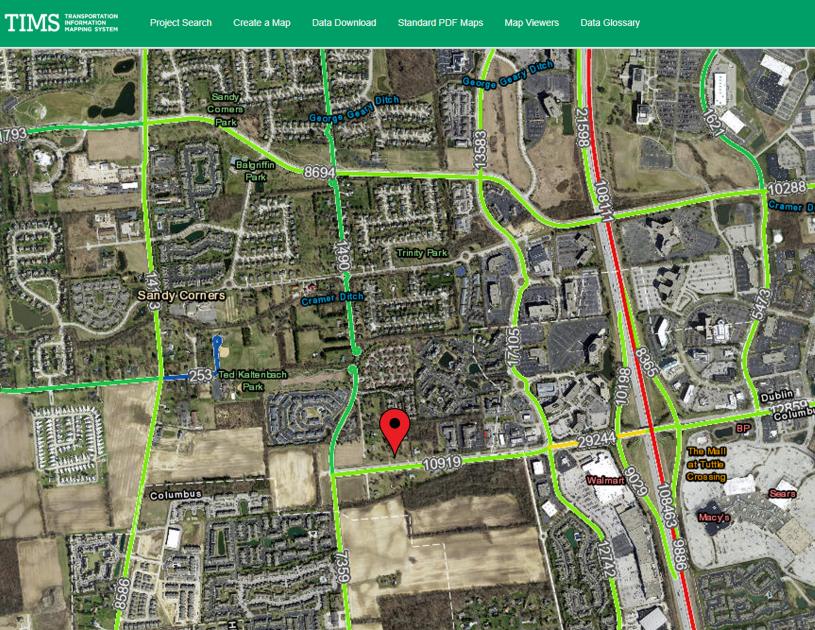
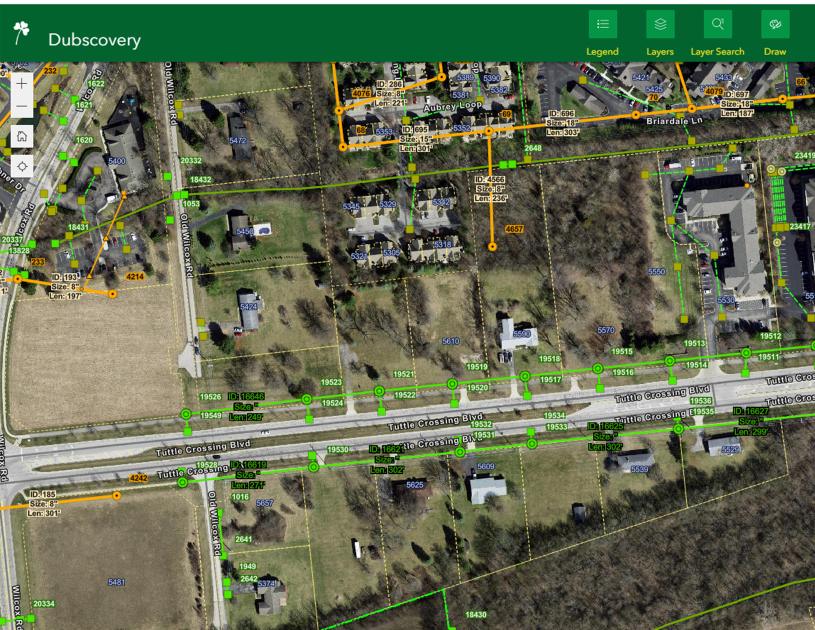
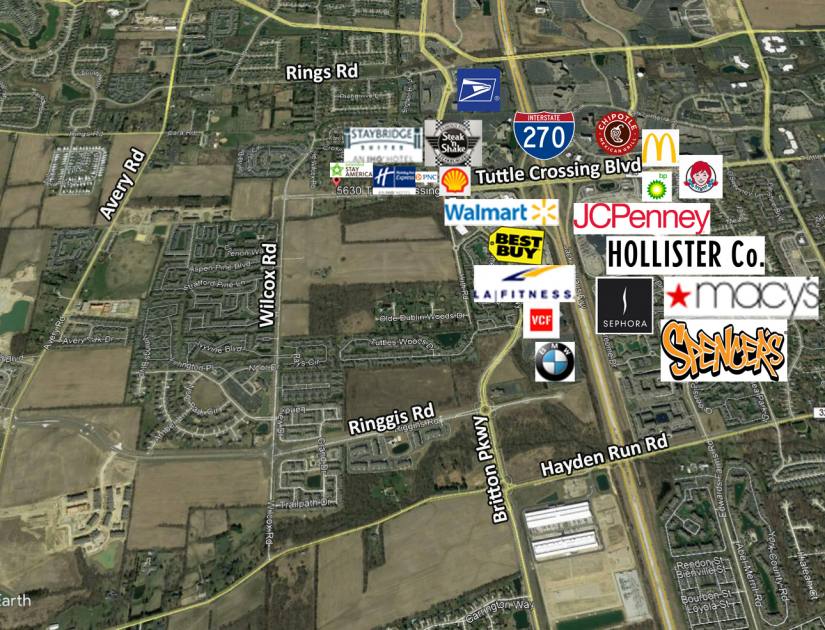
- • Great location minutes from Tuttle Mall and I-270
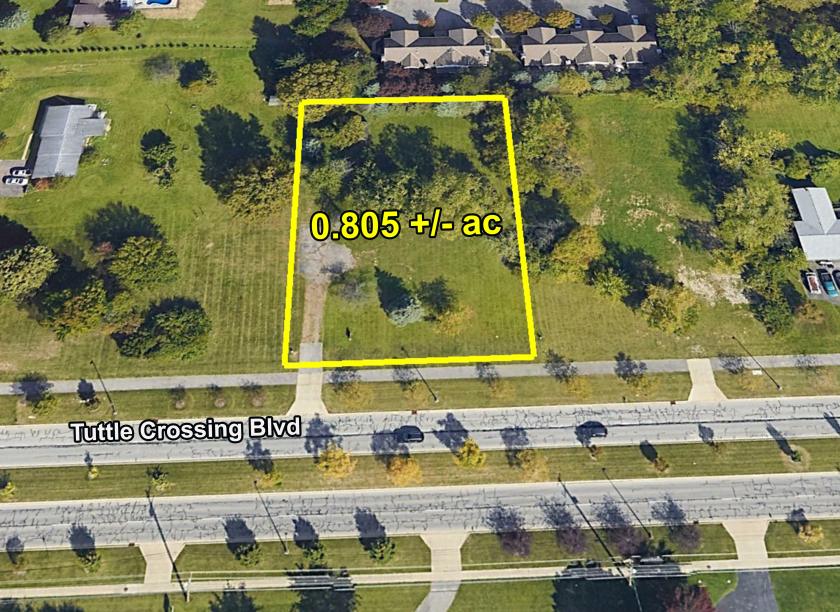
- • 150’ frontage on Tuttle Crossing Blvd
- • Ripe area for development
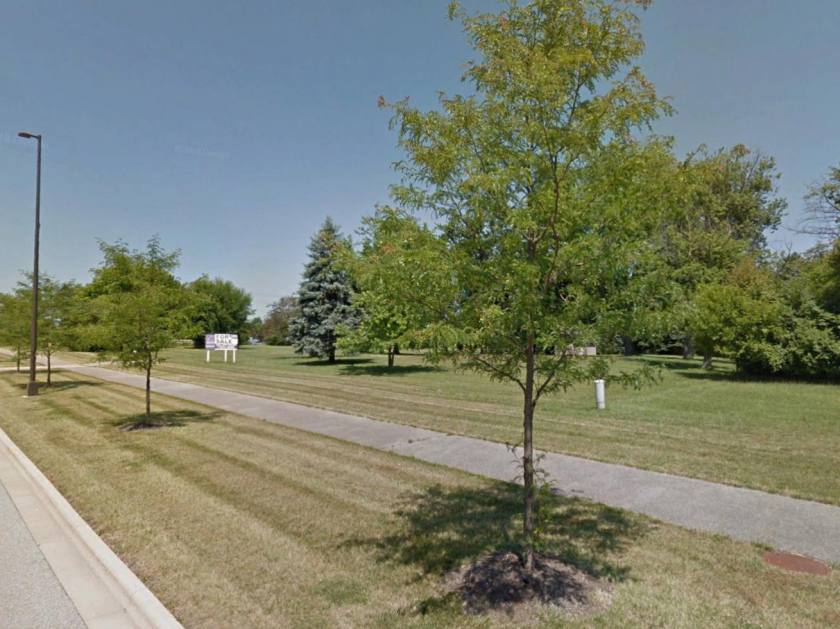
Additional Photos

Listing Agents

Skip Weiler
O: 614-221-4286
skip@rweiler.com
O: 614-221-4286
skip@rweiler.com
While we strive to provide the most accurate information, all listing information, and demographic data, is provided by third-parties. As such, MyEListing will not be responsible for the accuracy of the information. It is strongly recommended that you verify all information with the listing agent, and any relevant agencies, prior to making any decisions.