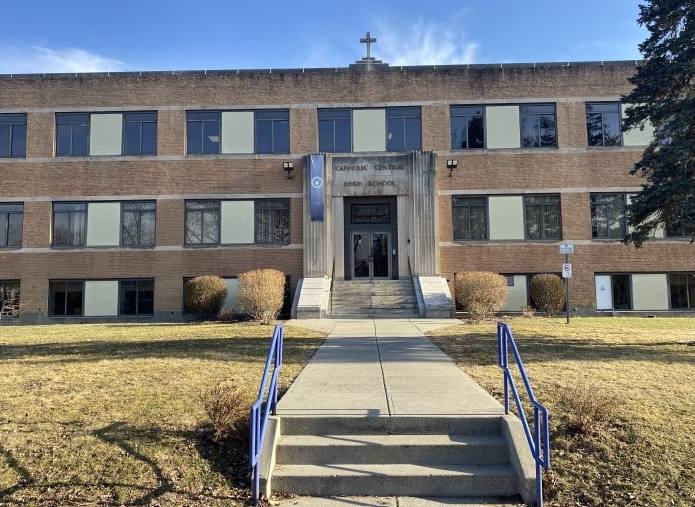
Specialty Real Estate
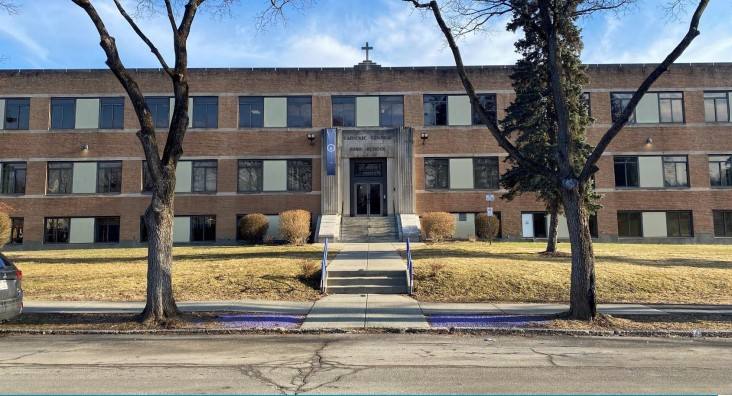
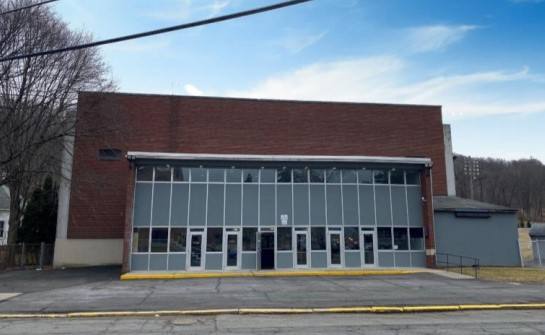
625 7th Avenue Troy, NY 12182
625 7th Avenue Troy, NY 12182
Details & Description
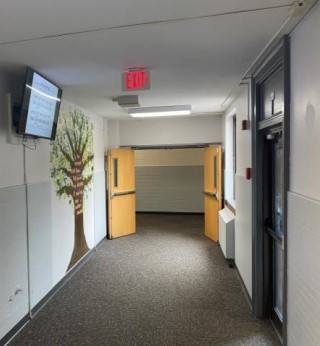
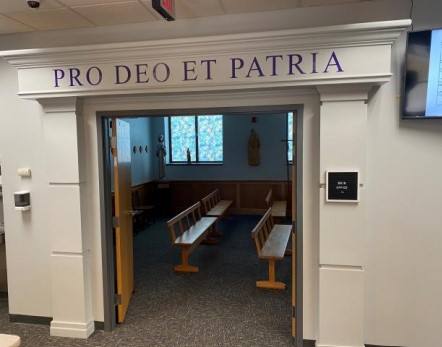
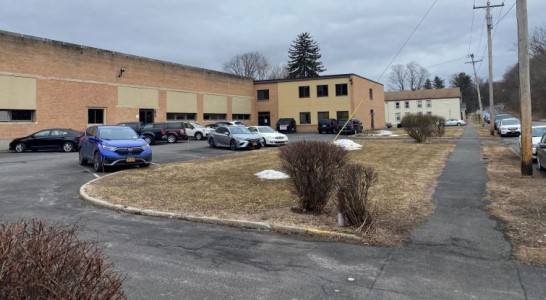
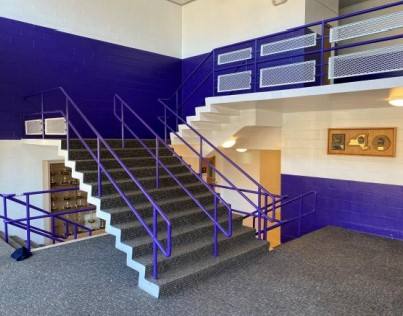
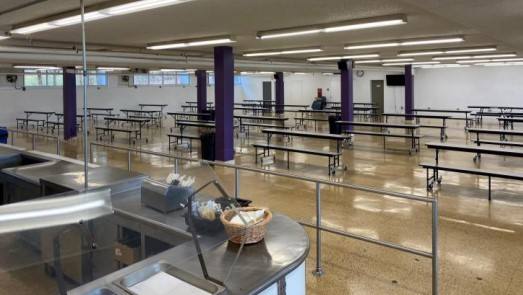
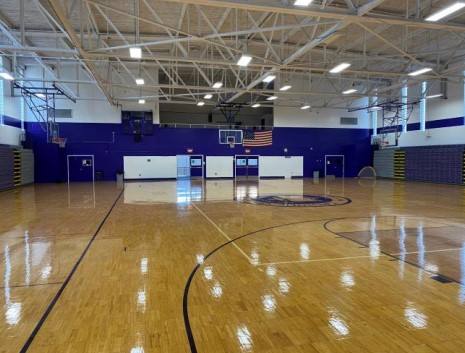
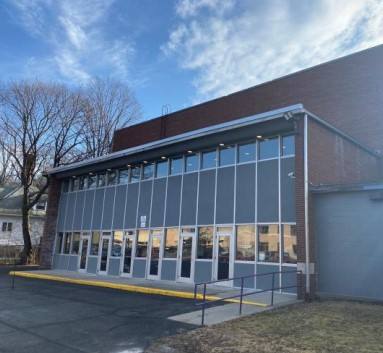
Additional Photos


Listing Agents

Joseph Mahoney
O: 518-489-9199
M: 518-859-2493
jmahoney@pyramidbrokerage.com
O: 518-489-9199
M: 518-859-2493
jmahoney@pyramidbrokerage.com
While we strive to provide the most accurate information, all listing information, and demographic data, is provided by third-parties. As such, MyEListing will not be responsible for the accuracy of the information. It is strongly recommended that you verify all information with the listing agent, and any relevant agencies, prior to making any decisions.