Commercial Land
3371 Reading Road Cincinnati, OH 45229
3371 Reading Road Cincinnati, OH 45229
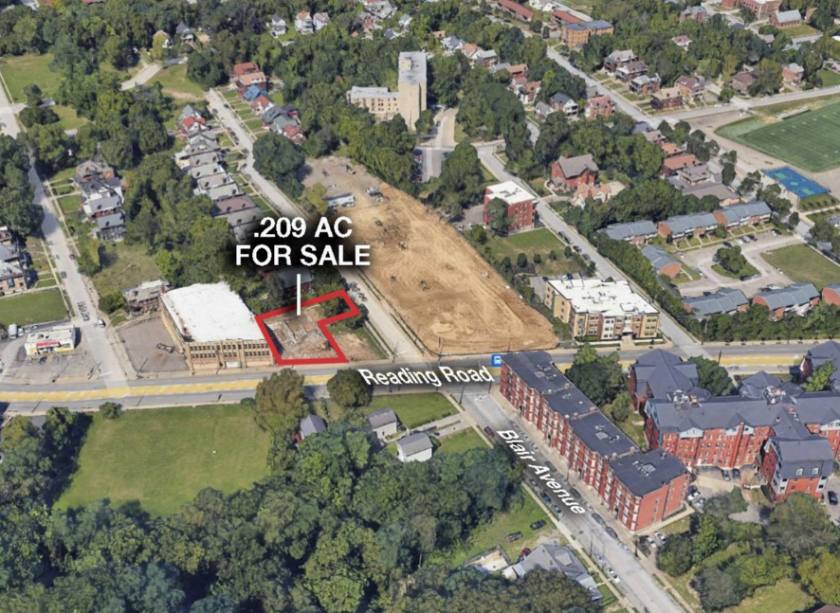
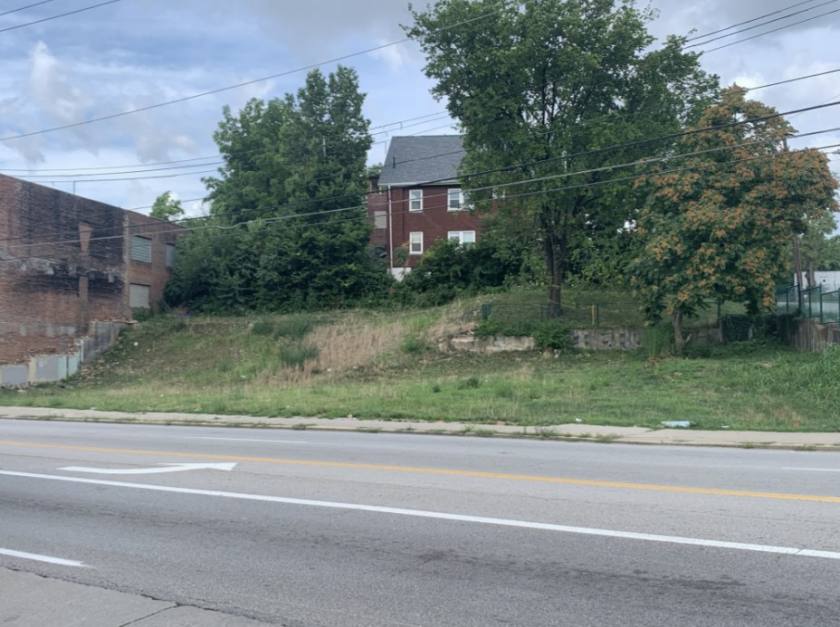
Details & Description
Property Highlights
• Adjacent to the Blair Lofts, $15M 64 Unit Affordable Housing Development
• Adjacent to the Blair Lofts, $15M 64 Unit Affordable Housing Development
Additional Photos


Listing Agents

Michael Bergman
O: 513-322-6309
M: 678-595-5954
mbergman@bergmancommercial.com
O: 513-322-6309
M: 678-595-5954
mbergman@bergmancommercial.com
While we strive to provide the most accurate information, all listing information, and demographic data, is provided by third-parties. As such, MyEListing will not be responsible for the accuracy of the information. It is strongly recommended that you verify all information with the listing agent, and any relevant agencies, prior to making any decisions.


