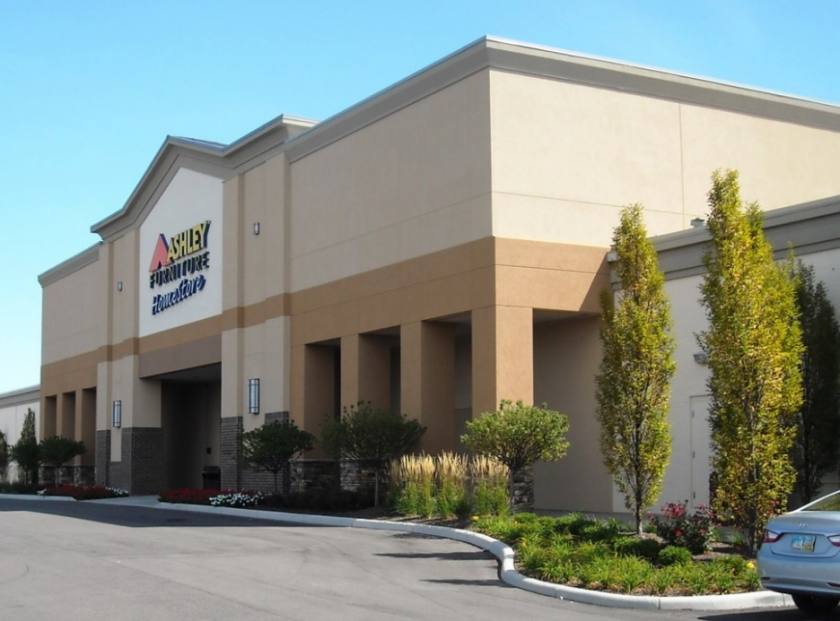
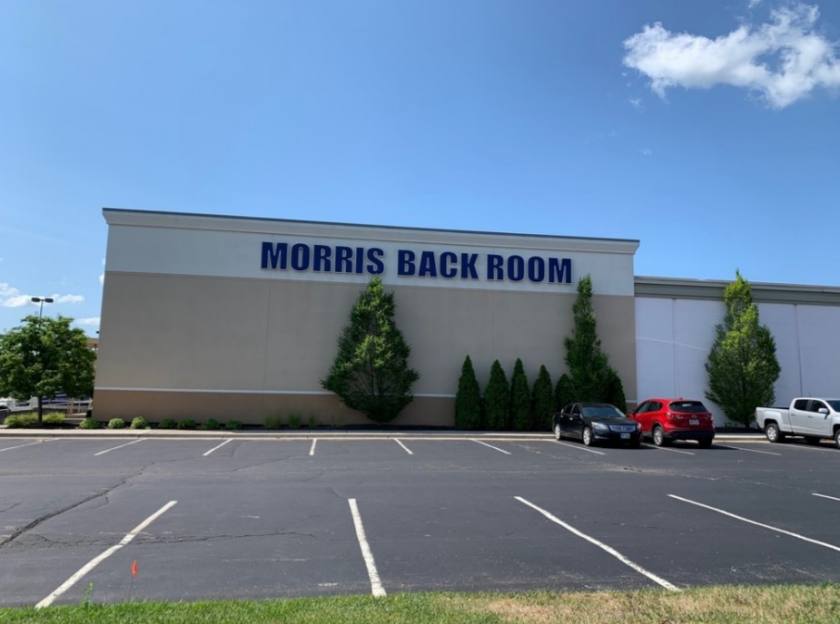
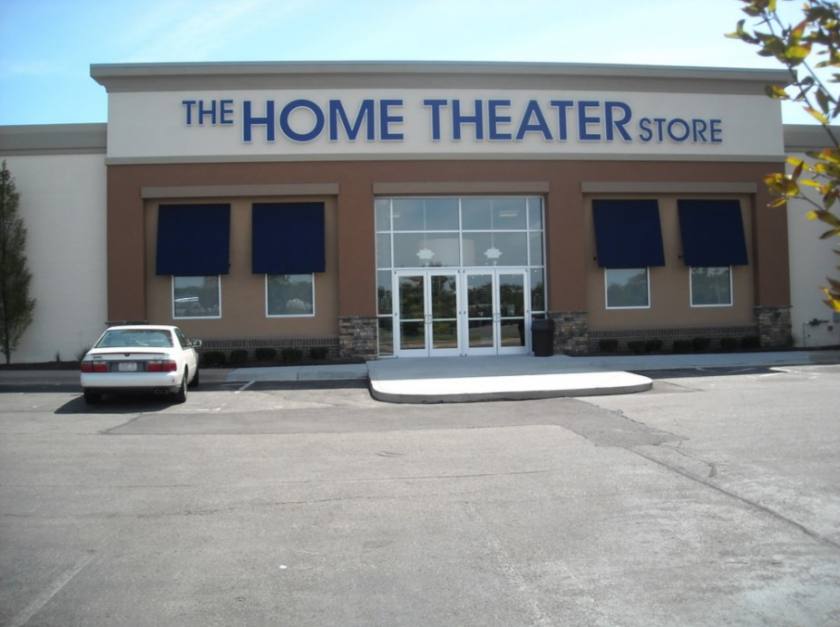
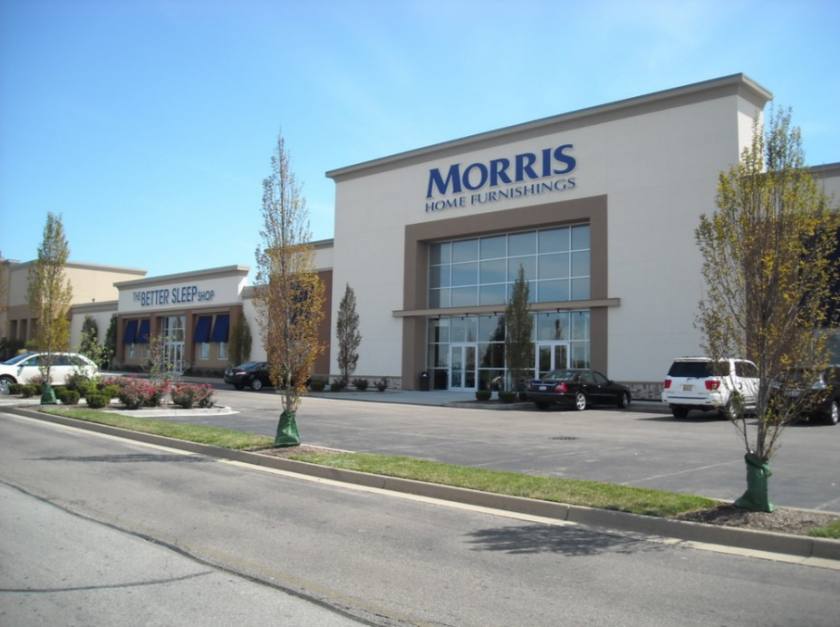
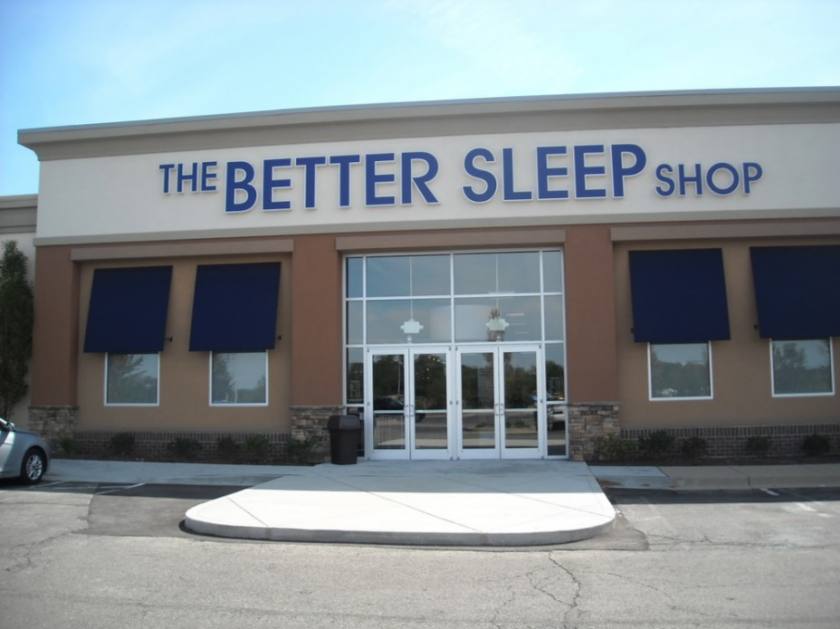
Retail Space
11925 Commons Drive Springdale, OH 45246
11925 Commons Drive Springdale, OH 45246
Details & Description
Property Highlights
- • Tremendous highway visibility and Signage
- • Excellent I-275 visibility
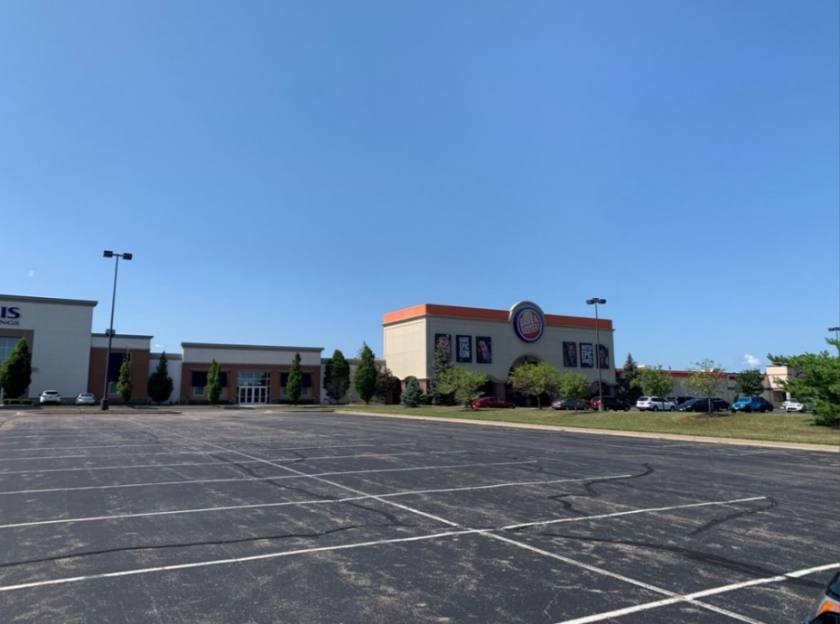
- • Adjacent to Tri-County Mall, Costco, & Target
- • Very attractive lease rates
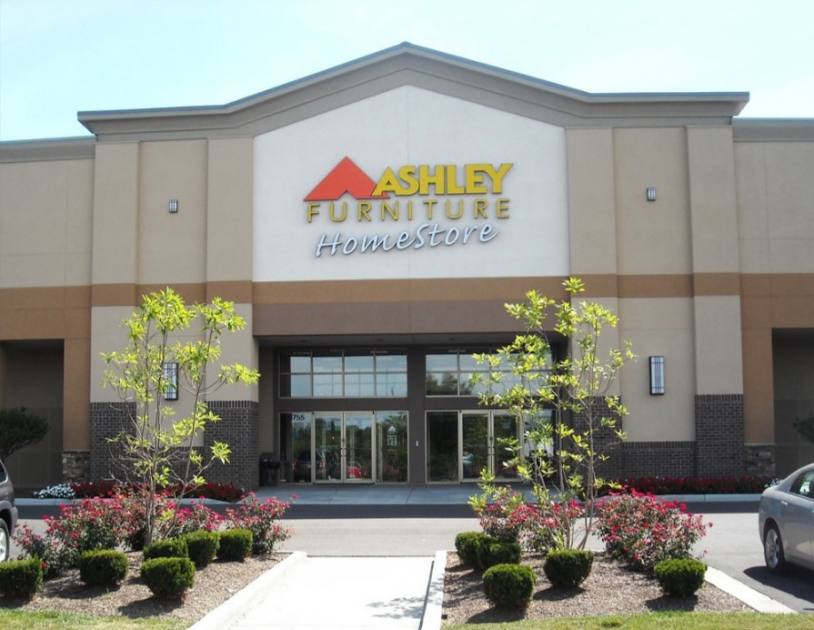
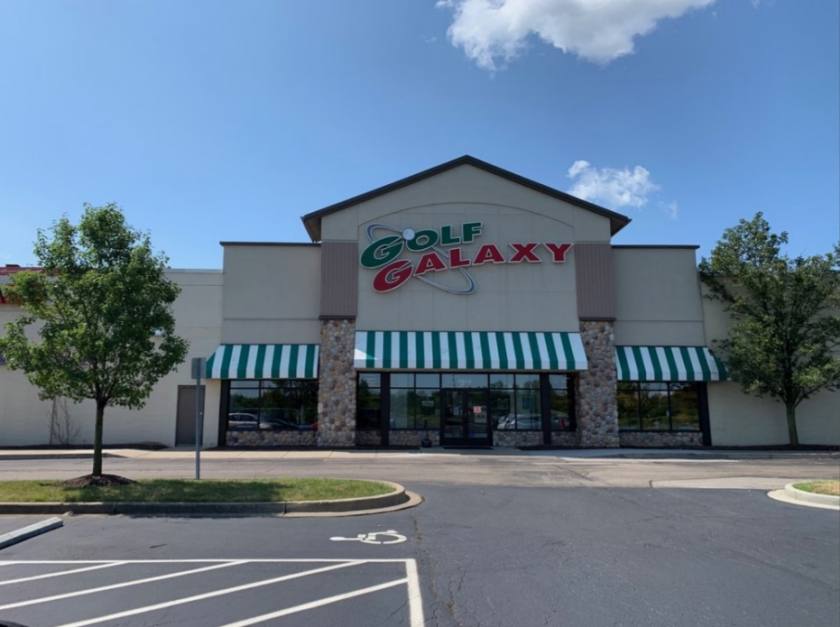
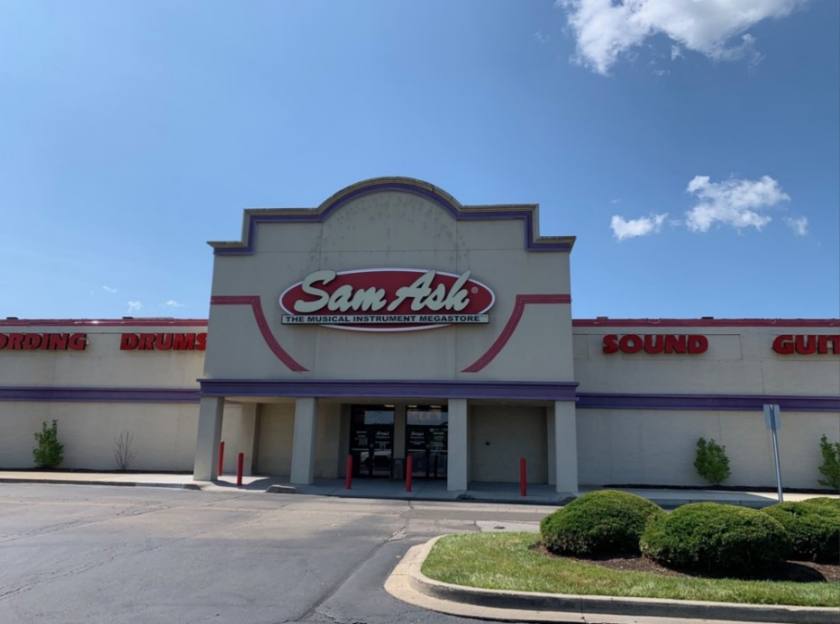
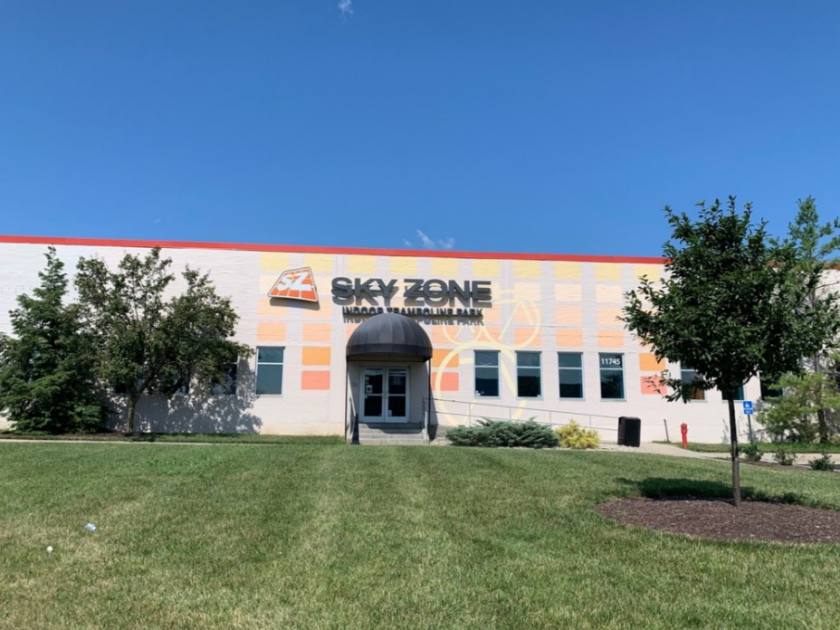
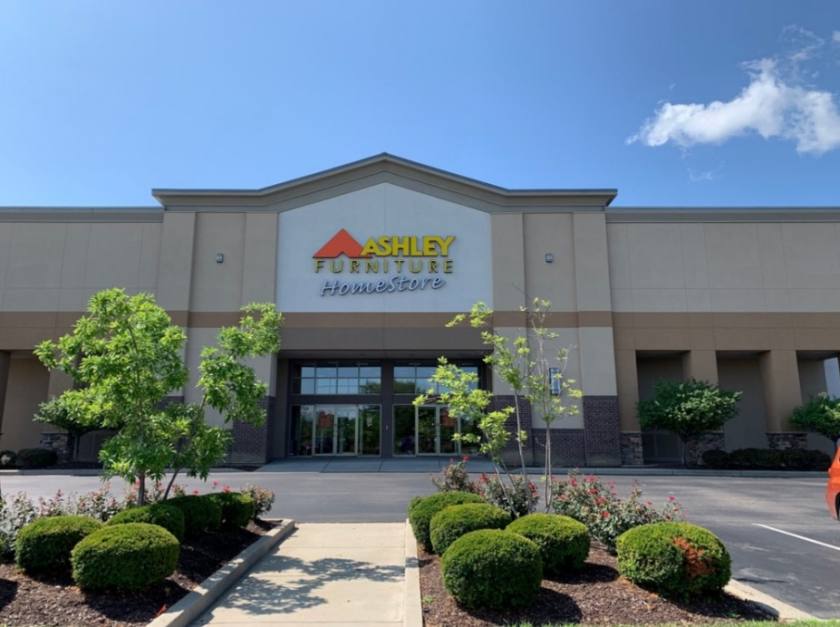
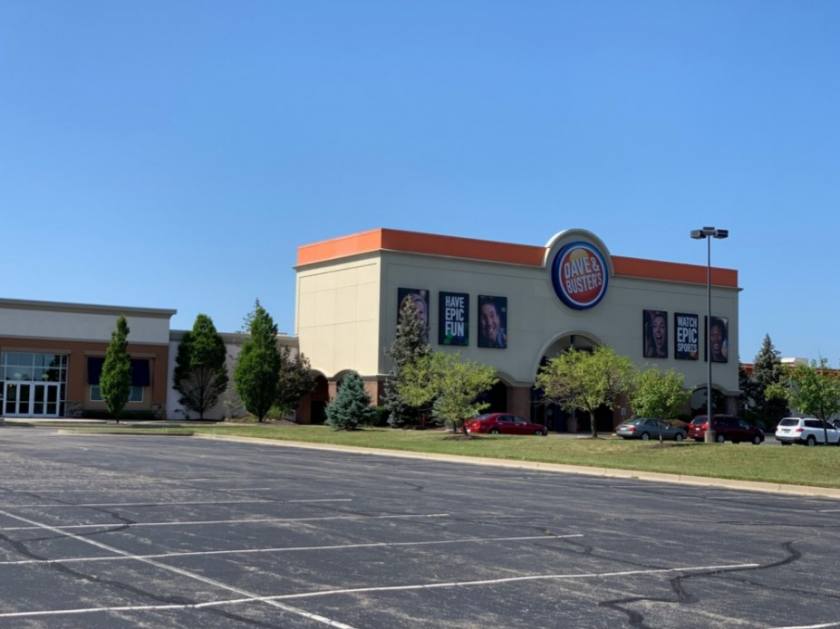
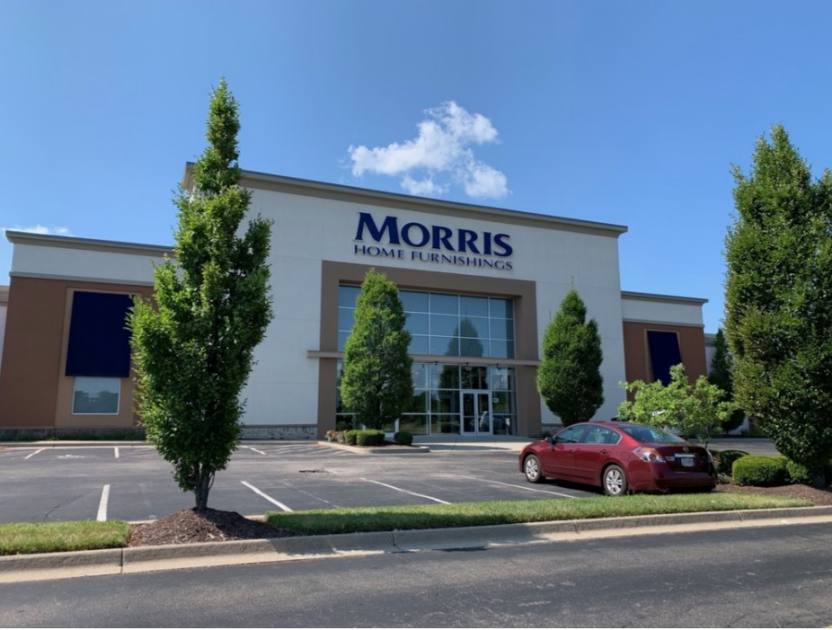
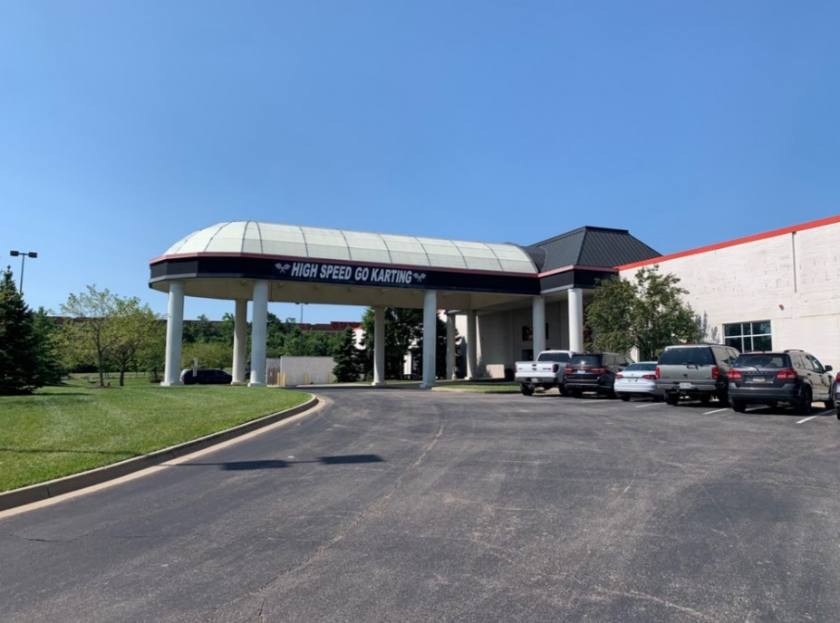
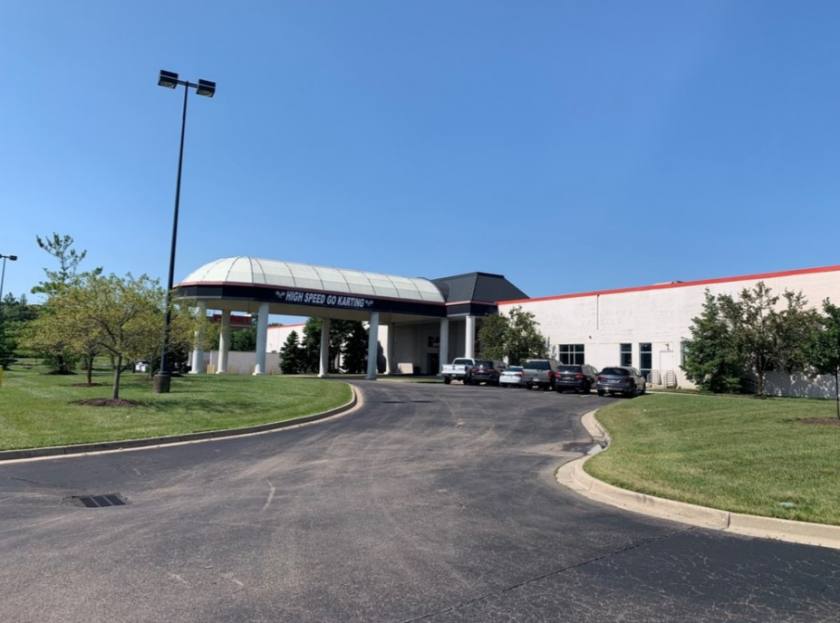
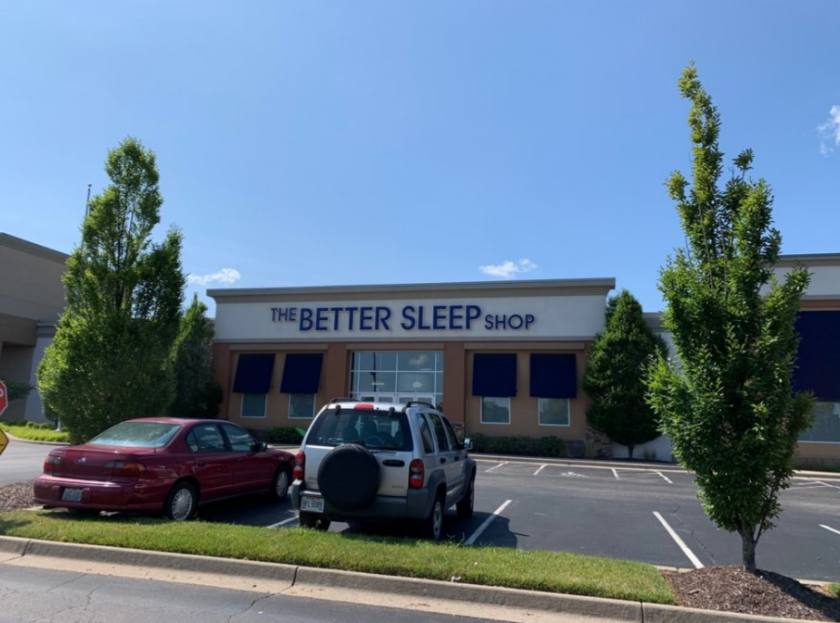
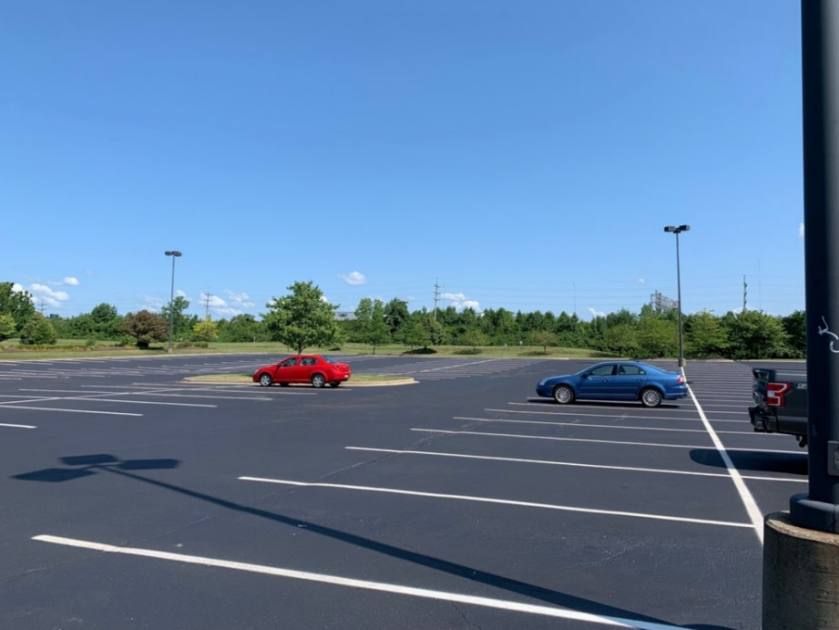
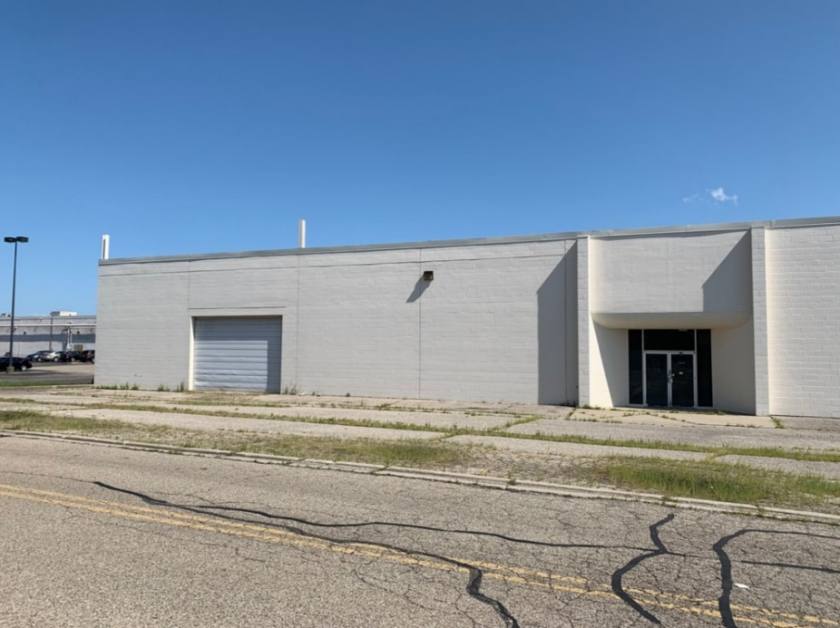
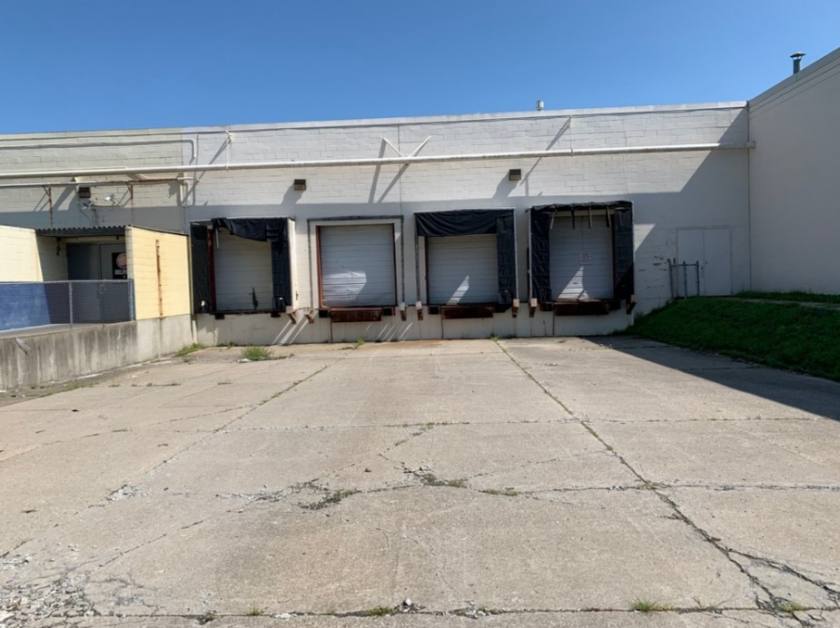
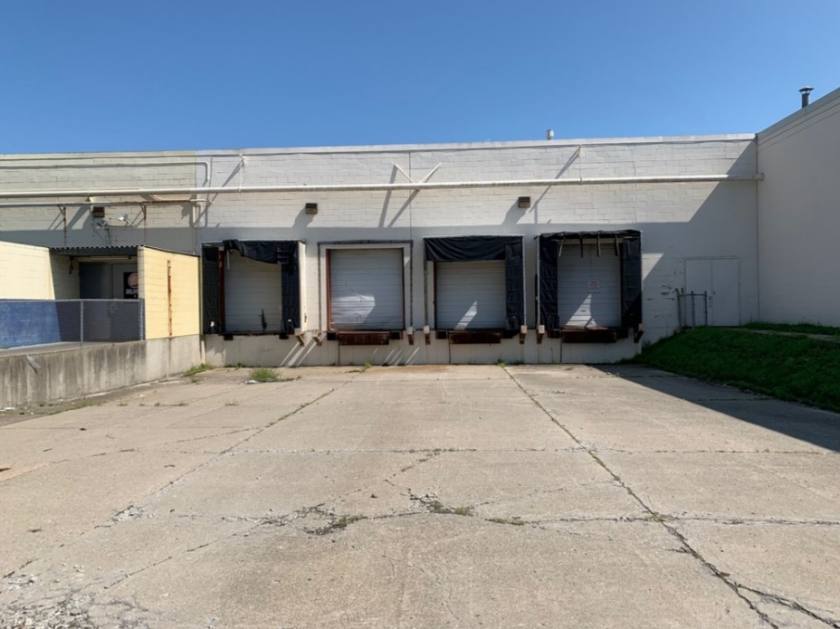
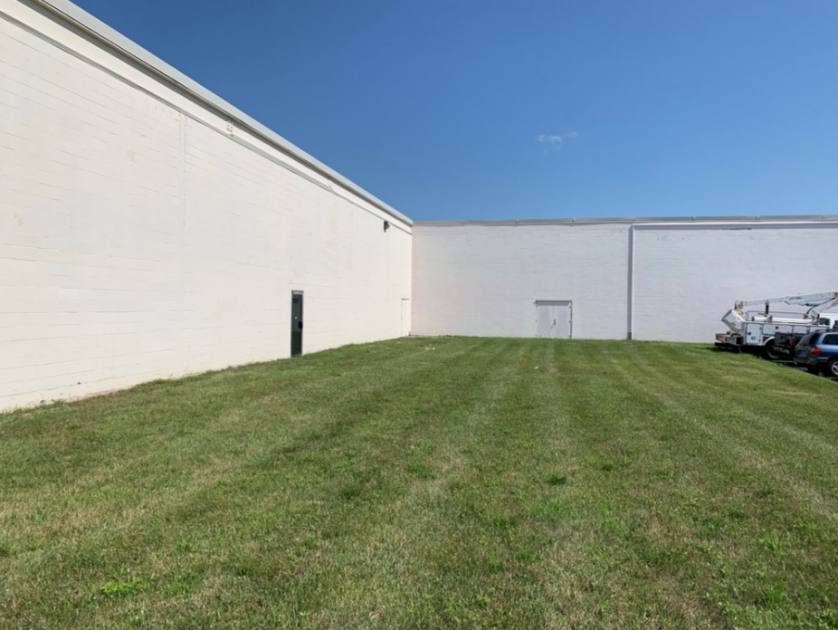
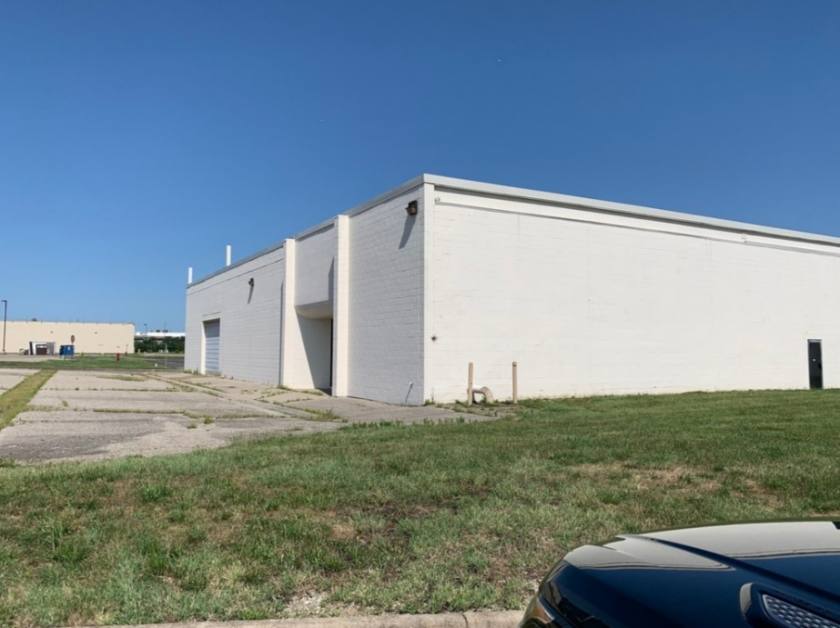
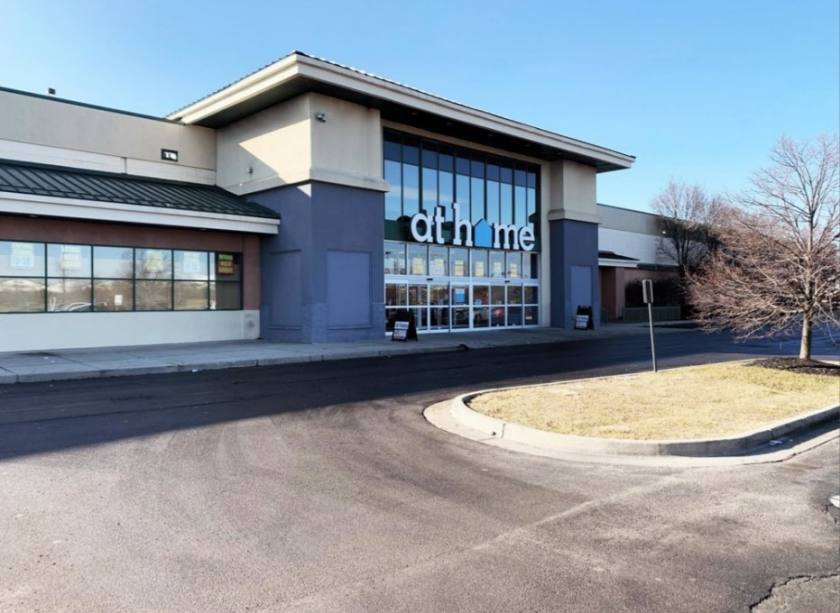
Additional Photos
Listing Agents

Michelle Levine
O: 513-322-8329
M: 513-602-5780
mlevine@bergman-group.com
O: 513-322-8329
M: 513-602-5780
mlevine@bergman-group.com

Billy Gillman
O: 513-322-6319
M: 513-604-4530
billy@bergmancommercial.com
O: 513-322-6319
M: 513-604-4530
billy@bergmancommercial.com

Laurence Bergman
O: 513-322-6307
M: 513-515-5488
larry@bergmancommercial.com
O: 513-322-6307
M: 513-515-5488
larry@bergmancommercial.com
While we strive to provide the most accurate information, all listing information, and demographic data, is provided by third-parties. As such, MyEListing will not be responsible for the accuracy of the information. It is strongly recommended that you verify all information with the listing agent, and any relevant agencies, prior to making any decisions.