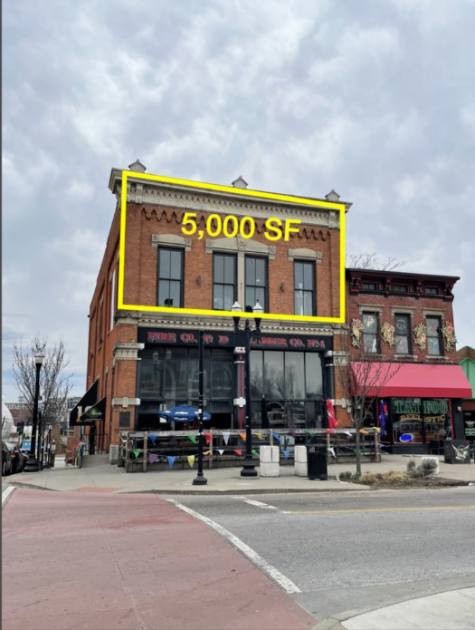
Office Space
2701 Short Vine Street Cincinnati, OH 45219
2701 Short Vine Street Cincinnati, OH 45219

Details & Description
Property Highlights
- • Sublease
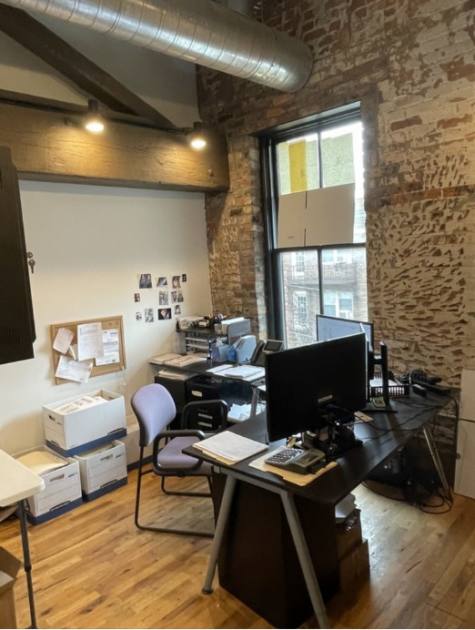
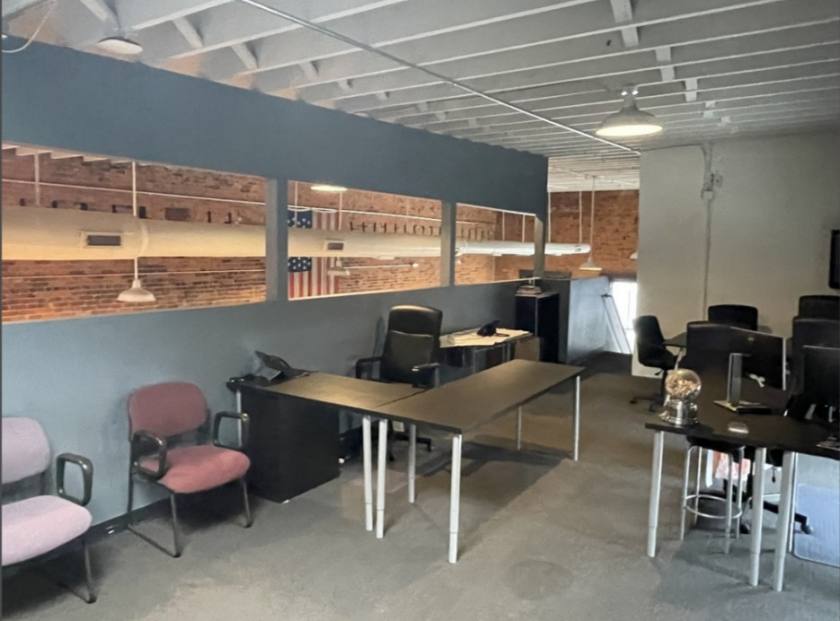
- • One of a Kind Loft space
- • Private offices
- • Open Space
- • 2 restrooms w/ Showers
- • Hardwood floors/Exposed Brick
Additional Photos


Listing Agents

Rob Hock
O: 513-322-6313
M: 513-300-9745
rob@bergmancommercial.com
O: 513-322-6313
M: 513-300-9745
rob@bergmancommercial.com
While we strive to provide the most accurate information, all listing information, and demographic data, is provided by third-parties. As such, MyEListing will not be responsible for the accuracy of the information. It is strongly recommended that you verify all information with the listing agent, and any relevant agencies, prior to making any decisions.