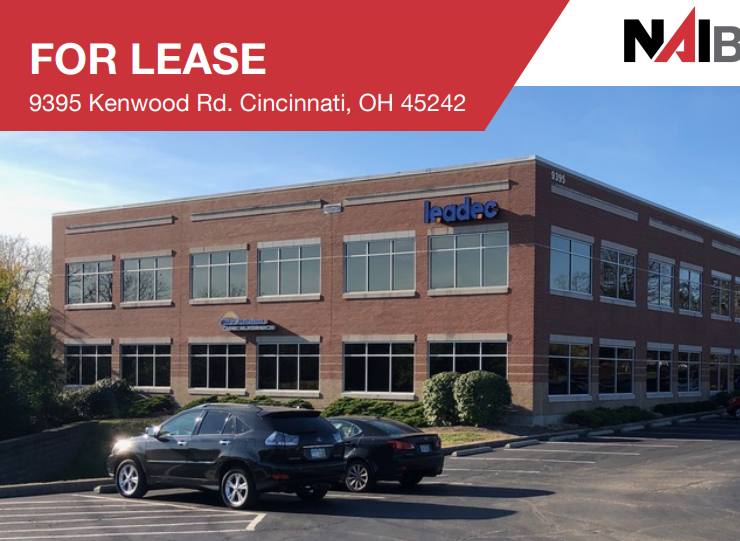
1-Mile | 3-Miles | 5-Miles | ||
---|---|---|---|---|
Total Population | 8,265 | 62,117 | 148,881 | |
Population Median Age | 42 | 42 | 41 | |
Population by Age | 0-9 Yrs | 1001 (12%) | 7351 (11%) | 18540 (12%) |
10-19 Yrs | 892 (10%) | 6378 (10%) | 16338 (10%) | |
20-29 Yrs | 839 (10%) | 6208 (9%) | 16138 (10%) | |
30-39 Yrs | 1080 (13%) | 8711 (14%) | 20805 (13%) | |
40-49 Yrs | 1008 (12%) | 7083 (11%) | 17153 (11%) | |
50-59 Yrs | 1174 (14%) | 9085 (14%) | 20167 (13%) | |
60-69 Yrs | 1110 (13%) | 8568 (13%) | 21008 (14%) | |
70+ Yrs | 1161 (14%) | 8734 (14%) | 18732 (12%) | |
Median HH Income | $88,032 | $83,008 | $70,181 | |
Total Household Income | < 24K | 413 (11%) | 3591 (13%) | 11641 (17%) |
25-49K | 609 (17%) | 4632 (17%) | 11936 (18%) | |
50-74K | 480 (13%) | 3984 (14%) | 10729 (16%) | |
75-99K | 517 (14%) | 3846 (14%) | 8167 (12%) | |
100-199K | 1174 (33%) | 7599 (28%) | 15154 (23%) | |
200K+ | 350 (9%) | 3227 (12%) | 7226 (11%) | |
Highest Education Level | No Diploma | 233 | 2316 | 7763 |
Diploma or GED | 999 | 9412 | 23355 | |
Some College | 1076 | 6762 | 16643 | |
Assoc. Degree | 376 | 3342 | 7876 | |
Bachelors Degree | 2000 | 14053 | 29799 | |
Higher Degree | 1328 | 10230 | 22080 | |
Total Housing Units | 3,841 | 28,604 | 69,825 | |
--Owner-Occupied | 2,412 | 19,667 | 41,861 | |
--Renter-Occupied | 1,130 | 7,212 | 22,992 | |
Owner-Occupied Values | < 100K | 161 | 1235 | 5361 |
100-199K | 744 | 8229 | 15107 | |
200-299K | 500 | 3635 | 7583 | |
300-399K | 508 | 2621 | 4827 | |
400-499K | 179 | 1528 | 3199 | |
500K+ | 320 | 2419 | 5784 | |
Total Working Age Population | 6,685 | 50,962 | 120,163 | |
In Work Force | 4,505 | 33,874 | 78,674 | |
Not In Work Force | 2,180 | 17,088 | 41,489 | |
Workforce Employed | 4,390 | 32,733 | 75,439 | |
Workforce Unemployed | 115 | 1,141 | 3,235 | |
Civlian Workforce | 4,505 | 33,874 | 78,674 | |
Military Workforce | 0 | 0 | 0 | |
Total Households | 3,542 | 26,879 | 64,854 | |
Family Households | 2,297 | 16,541 | 38,762 | |
Non-Family Households | 1,245 | 10,338 | 26,092 | |
Married Couple | 1,681 | 13,343 | 28,989 | |
Other Family | 616 | 3,198 | 9,773 | |
Married w/Child | 645 | 4,963 | 11,179 | |
Single Male w/Child | 150 | 478 | 1,116 | |
Single Female w/Child | 190 | 1,101 | 3,887 |
Population Change Last Two Decades - Plus Projection
2000 | % | 2010 | % | 2020 | % | 2030 | |
---|---|---|---|---|---|---|---|
Ohio | 11,353,140 | +2 | 11,536,504 | 0 | 11,574,870 | 0 | 11,615,100 |
Hamilton County | 845,303 | -5 | 802,374 | -1 | 790,600 | -1 | 785,900 |
Butler County | 332,807 | +11 | 368,130 | +6 | 390,110 | +5 | 410,960 |
Clermont County | 177,977 | +11 | 197,363 | +6 | 208,330 | +3 | 214,090 |
Warren County | 158,383 | +34 | 212,693 | +6 | 225,770 | +4 | 235,640 |
Total Working Age Population:
Total Households:
Total Working Age Population:
Total Households:
Total Working Age Population:
Total Households: