Retail Space
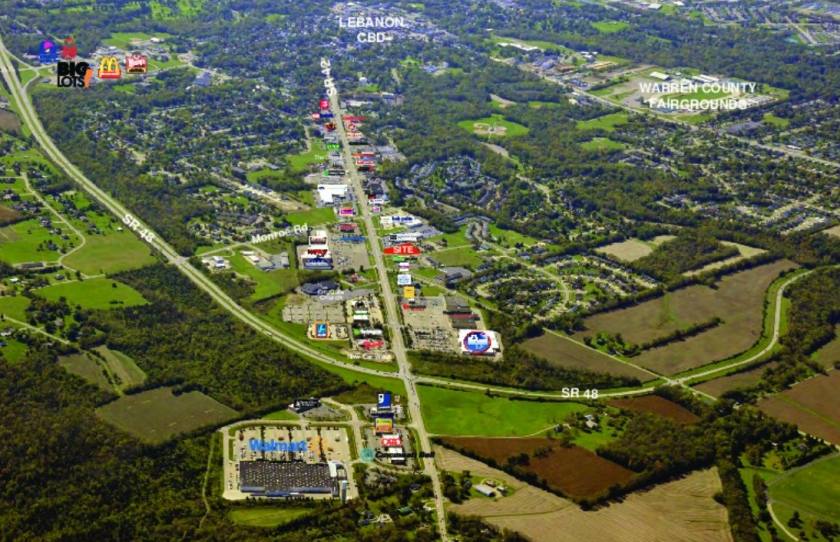
1000 Belvedere Drive Lebanon, OH 45036
1000 Belvedere Drive Lebanon, OH 45036

Details & Description
Property Highlights
- • Available for Ground Lease or a Build To Suit
- • Former Pizza Hut
- • Drive Thru
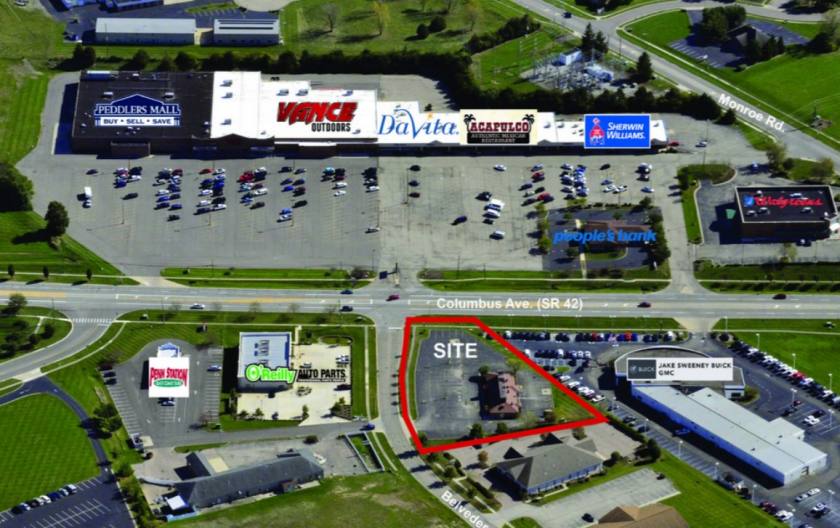
- • Corner Location
Additional Photos

Listing Agents

Robert Zavakos
O: 937-603-3300
M: 937-603-3300
rlzavakos@bergmancommercial.com
O: 937-603-3300
M: 937-603-3300
rlzavakos@bergmancommercial.com
While we strive to provide the most accurate information, all listing information, and demographic data, is provided by third-parties. As such, MyEListing will not be responsible for the accuracy of the information. It is strongly recommended that you verify all information with the listing agent, and any relevant agencies, prior to making any decisions.


