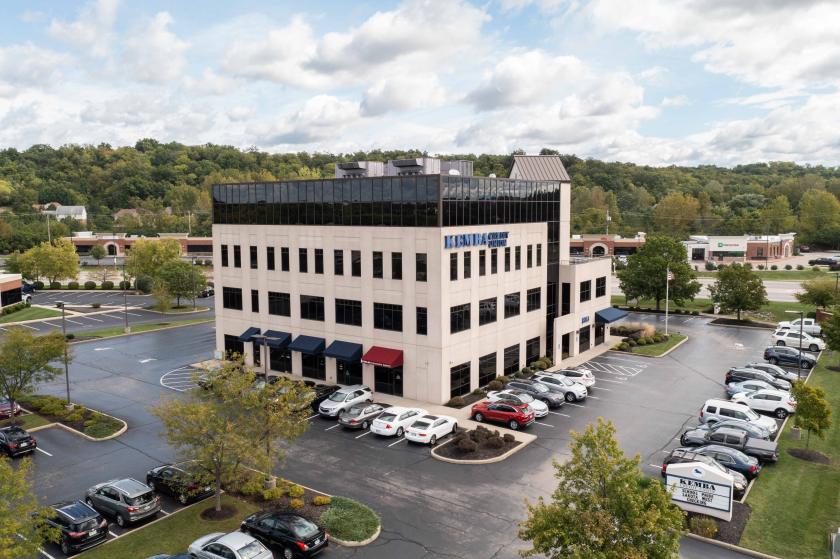
1-Mile | 3-Miles | 5-Miles | ||
---|---|---|---|---|
Total Population | 4,307 | 47,548 | 135,560 | |
Population Median Age | 39 | 37 | 38 | |
Population by Age | 0-9 Yrs | 563 (13%) | 6986 (14%) | 18015 (13%) |
10-19 Yrs | 589 (13%) | 6370 (13%) | 17906 (13%) | |
20-29 Yrs | 487 (11%) | 5447 (11%) | 17218 (12%) | |
30-39 Yrs | 627 (14%) | 6706 (14%) | 17605 (12%) | |
40-49 Yrs | 473 (10%) | 6404 (13%) | 17991 (13%) | |
50-59 Yrs | 616 (14%) | 6327 (13%) | 17516 (12%) | |
60-69 Yrs | 578 (13%) | 5495 (11%) | 16601 (12%) | |
70+ Yrs | 374 (8%) | 3813 (8%) | 12709 (9%) | |
Median HH Income | $99,253 | $95,119 | $85,310 | |
Total Household Income | < 24K | 182 (10%) | 1774 (9%) | 5886 (11%) |
25-49K | 289 (17%) | 2541 (14%) | 7997 (15%) | |
50-74K | 189 (11%) | 2686 (15%) | 8693 (17%) | |
75-99K | 193 (11%) | 2362 (13%) | 7183 (14%) | |
100-199K | 528 (31%) | 6223 (34%) | 16119 (31%) | |
200K+ | 313 (18%) | 2219 (12%) | 5198 (10%) | |
Highest Education Level | No Diploma | 134 | 1690 | 5514 |
Diploma or GED | 595 | 6057 | 21439 | |
Some College | 361 | 5638 | 17016 | |
Assoc. Degree | 186 | 2038 | 6571 | |
Bachelors Degree | 987 | 9795 | 25732 | |
Higher Degree | 659 | 6252 | 14716 | |
Total Housing Units | 1,814 | 18,408 | 53,563 | |
--Owner-Occupied | 1,269 | 12,857 | 35,935 | |
--Renter-Occupied | 426 | 4,949 | 15,141 | |
Owner-Occupied Values | < 100K | 171 | 1259 | 3807 |
100-199K | 407 | 2878 | 12211 | |
200-299K | 173 | 5348 | 12269 | |
300-399K | 237 | 2209 | 4748 | |
400-499K | 231 | 671 | 1450 | |
500K+ | 50 | 492 | 1449 | |
Total Working Age Population | 3,405 | 36,377 | 106,486 | |
In Work Force | 2,292 | 25,853 | 73,254 | |
Not In Work Force | 1,113 | 10,524 | 33,232 | |
Workforce Employed | 2,204 | 24,603 | 70,201 | |
Workforce Unemployed | 89 | 1,215 | 2,976 | |
Civlian Workforce | 2,292 | 25,818 | 73,177 | |
Military Workforce | 0 | 35 | 78 | |
Total Households | 1,695 | 17,806 | 51,076 | |
Family Households | 1,155 | 12,793 | 35,140 | |
Non-Family Households | 540 | 5,013 | 15,936 | |
Married Couple | 898 | 10,387 | 28,063 | |
Other Family | 256 | 2,406 | 7,077 | |
Married w/Child | 385 | 4,727 | 12,191 | |
Single Male w/Child | 49 | 307 | 1,022 | |
Single Female w/Child | 124 | 1,098 | 2,952 |
Population Change Last Two Decades - Plus Projection
2000 | % | 2010 | % | 2020 | % | 2030 | |
---|---|---|---|---|---|---|---|
Ohio | 11,353,140 | +2 | 11,536,504 | 0 | 11,574,870 | 0 | 11,615,100 |
Hamilton County | 845,303 | -5 | 802,374 | -1 | 790,600 | -1 | 785,900 |
Butler County | 332,807 | +11 | 368,130 | +6 | 390,110 | +5 | 410,960 |
Warren County | 158,383 | +34 | 212,693 | +6 | 225,770 | +4 | 235,640 |
Total Working Age Population:
Total Households:
Total Working Age Population:
Total Households:
Total Working Age Population:
Total Households: