Specialty Real Estate
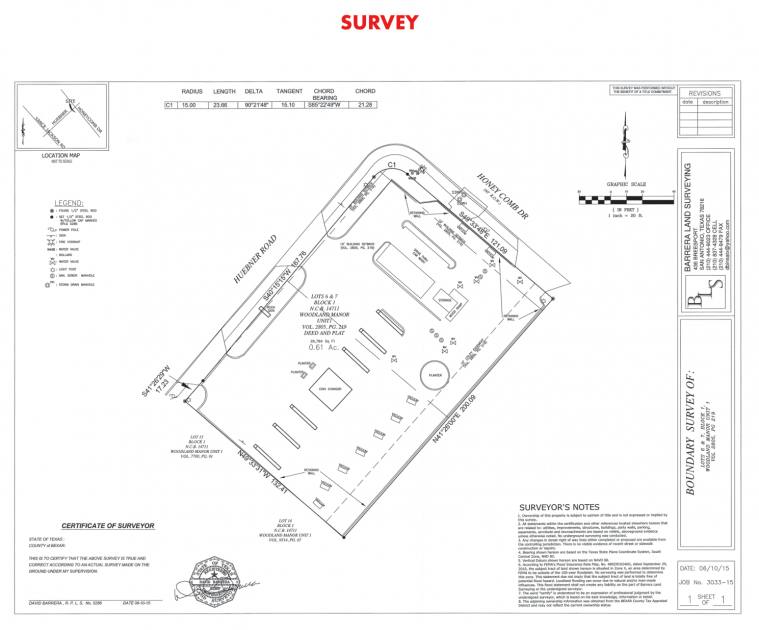
11914 Huebner Road San Antonio, TX 78230
11914 Huebner Road San Antonio, TX 78230

Details & Description
Property Highlights
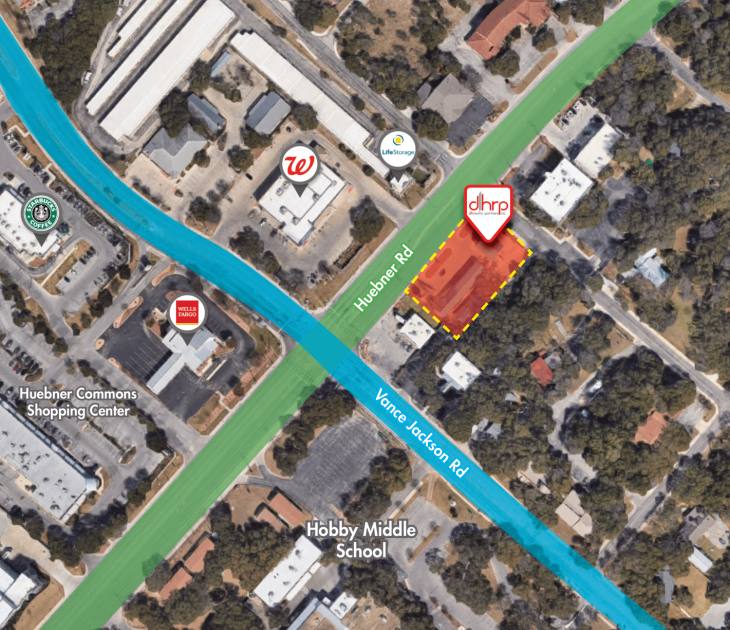
- • Easy access to I-10
- • Next to Huebner Express convenience store
- • Surrounded by residential neighborhoods
Additional Photos


Listing Agents

John Cannon
O: 210-222-2424
M: 210-386-6410
cannon@dhrp.us
O: 210-222-2424
M: 210-386-6410
cannon@dhrp.us
While we strive to provide the most accurate information, all listing information, and demographic data, is provided by third-parties. As such, MyEListing will not be responsible for the accuracy of the information. It is strongly recommended that you verify all information with the listing agent, and any relevant agencies, prior to making any decisions.