Industrial Properties
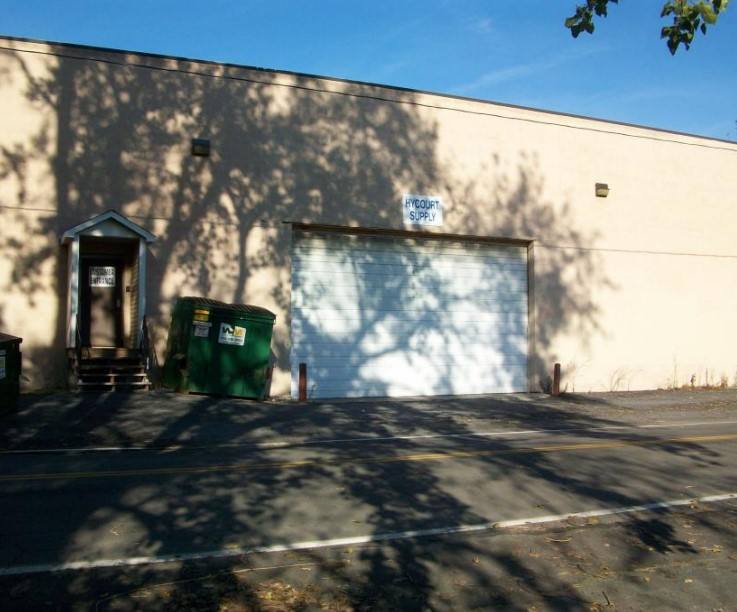
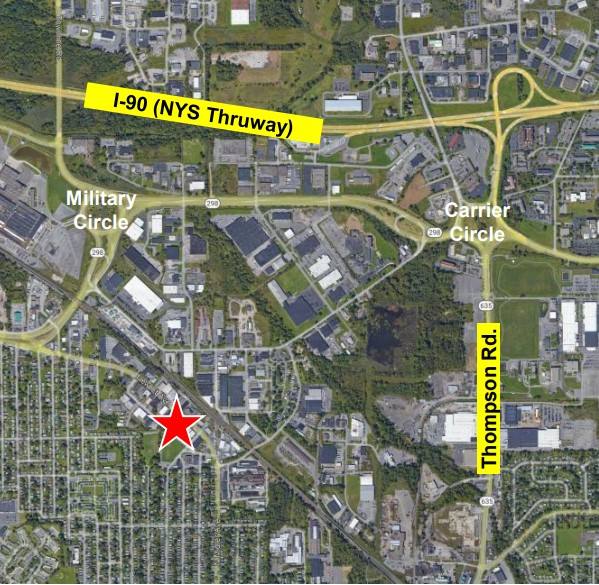
4054 New Court Avenue Syracuse, NY 13206
4054 New Court Avenue Syracuse, NY 13206

Details & Description
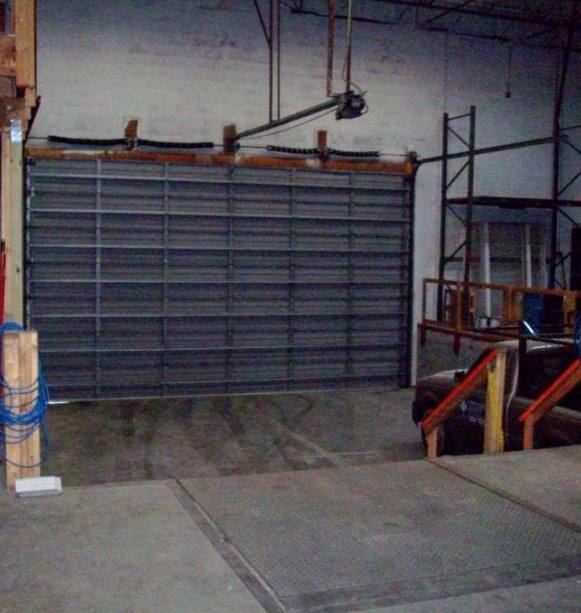
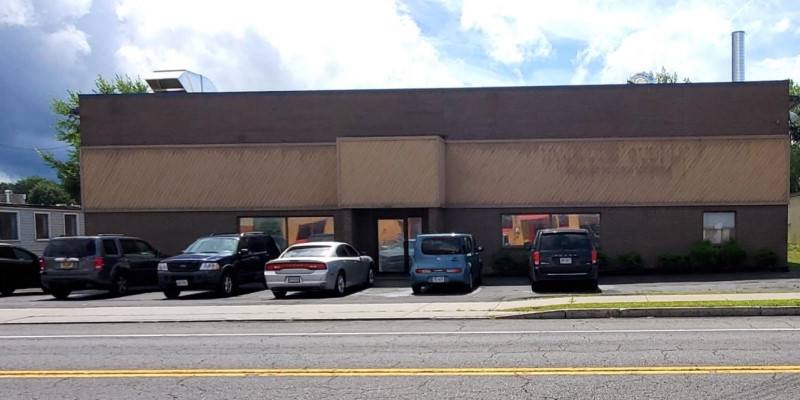
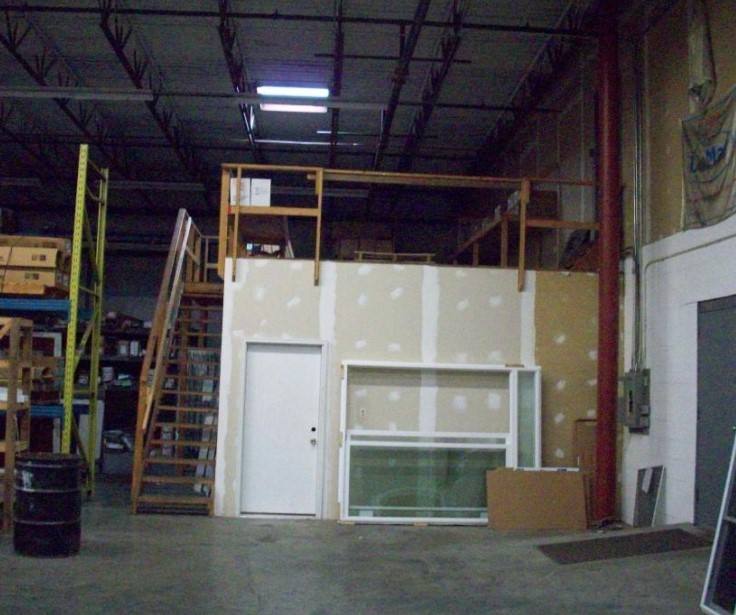
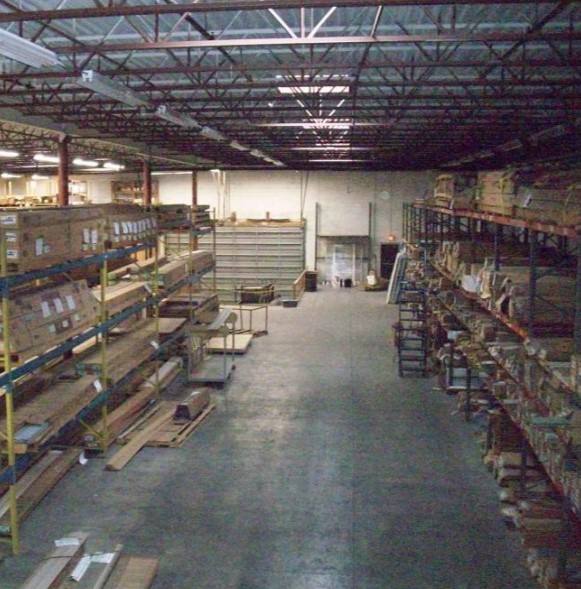
Additional Photos
Listing Agents

Paul B. Mackey
O: 315-382-8700
pmackey@pyramidbrokerage.com
O: 315-382-8700
pmackey@pyramidbrokerage.com

Brian M. Balash
O: 315-445-8506
M: 315-408-4620
bbalash@pyramidbrokerage.com
O: 315-445-8506
M: 315-408-4620
bbalash@pyramidbrokerage.com
While we strive to provide the most accurate information, all listing information, and demographic data, is provided by third-parties. As such, MyEListing will not be responsible for the accuracy of the information. It is strongly recommended that you verify all information with the listing agent, and any relevant agencies, prior to making any decisions.