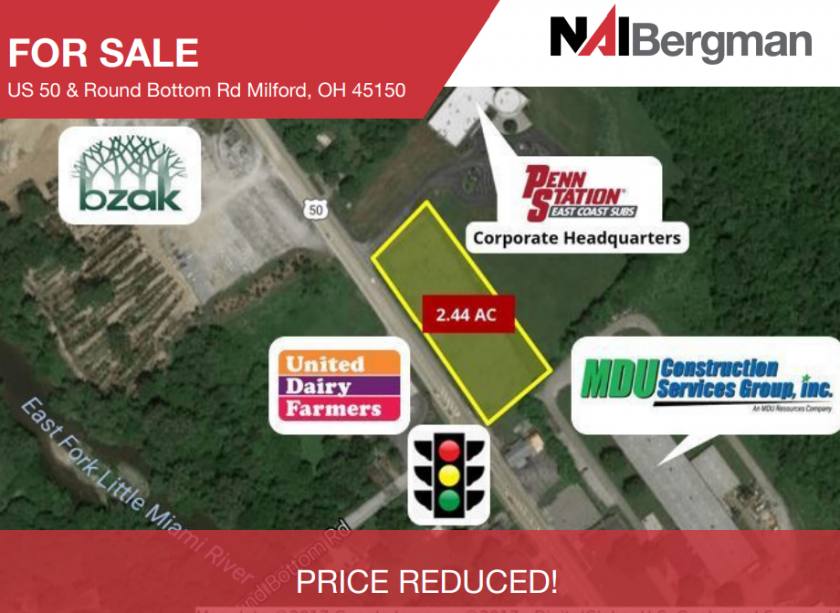
1-Mile | 3-Miles | 5-Miles | ||
---|---|---|---|---|
Total Population | 1,453 | 22,317 | 76,479 | |
Population Median Age | 41 | 39 | 40 | |
Population by Age | 0-9 Yrs | 152 (10%) | 2778 (12%) | 9501 (12%) |
10-19 Yrs | 196 (13%) | 3281 (14%) | 9696 (12%) | |
20-29 Yrs | 177 (12%) | 2640 (11%) | 9612 (12%) | |
30-39 Yrs | 154 (10%) | 2645 (11%) | 9511 (12%) | |
40-49 Yrs | 176 (12%) | 2940 (13%) | 8949 (11%) | |
50-59 Yrs | 210 (14%) | 3240 (14%) | 10683 (13%) | |
60-69 Yrs | 187 (12%) | 2541 (11%) | 9545 (12%) | |
70+ Yrs | 201 (13%) | 2252 (10%) | 8982 (11%) | |
Median HH Income | $79,589 | $88,413 | $71,540 | |
Total Household Income | < 24K | 63 (10%) | 633 (8%) | 4956 (16%) |
25-49K | 91 (15%) | 1228 (15%) | 5813 (19%) | |
50-74K | 120 (20%) | 1437 (18%) | 5153 (16%) | |
75-99K | 78 (13%) | 1206 (15%) | 4189 (13%) | |
100-199K | 195 (33%) | 2789 (35%) | 8348 (27%) | |
200K+ | 29 (5%) | 598 (7%) | 2101 (6%) | |
Highest Education Level | No Diploma | 59 | 1072 | 4025 |
Diploma or GED | 238 | 3972 | 15466 | |
Some College | 238 | 2837 | 9949 | |
Assoc. Degree | 75 | 1384 | 5338 | |
Bachelors Degree | 300 | 3998 | 11216 | |
Higher Degree | 143 | 2043 | 7165 | |
Total Housing Units | 609 | 8,219 | 31,810 | |
--Owner-Occupied | 483 | 6,846 | 21,560 | |
--Renter-Occupied | 93 | 1,045 | 8,999 | |
Owner-Occupied Values | < 100K | 28 | 531 | 2132 |
100-199K | 199 | 2811 | 9171 | |
200-299K | 206 | 2214 | 6433 | |
300-399K | 32 | 749 | 2055 | |
400-499K | 10 | 328 | 834 | |
500K+ | 8 | 213 | 935 | |
Total Working Age Population | 1,192 | 17,408 | 60,758 | |
In Work Force | 792 | 12,298 | 40,792 | |
Not In Work Force | 400 | 5,110 | 19,966 | |
Workforce Employed | 781 | 11,792 | 39,319 | |
Workforce Unemployed | 12 | 506 | 1,403 | |
Civlian Workforce | 792 | 12,298 | 40,722 | |
Military Workforce | 0 | 0 | 70 | |
Total Households | 576 | 7,891 | 30,560 | |
Family Households | 393 | 6,200 | 20,428 | |
Non-Family Households | 184 | 1,691 | 10,132 | |
Married Couple | 340 | 5,196 | 15,878 | |
Other Family | 52 | 1,004 | 4,550 | |
Married w/Child | 149 | 2,239 | 6,289 | |
Single Male w/Child | 9 | 162 | 648 | |
Single Female w/Child | 20 | 316 | 1,562 |
Population Change Last Two Decades - Plus Projection
2000 | % | 2010 | % | 2020 | % | 2030 | |
---|---|---|---|---|---|---|---|
Ohio | 11,353,140 | +2 | 11,536,504 | 0 | 11,574,870 | 0 | 11,615,100 |
Hamilton County | 845,303 | -5 | 802,374 | -1 | 790,600 | -1 | 785,900 |
Clermont County | 177,977 | +11 | 197,363 | +6 | 208,330 | +3 | 214,090 |
Total Working Age Population:
Total Households:
Total Working Age Population:
Total Households:
Total Working Age Population:
Total Households: