Commercial Land
US 42 and SR 48 Lebanon Lebanon, OH 45036
US 42 and SR 48 Lebanon Lebanon, OH 45036

Details & Description
Property Highlights
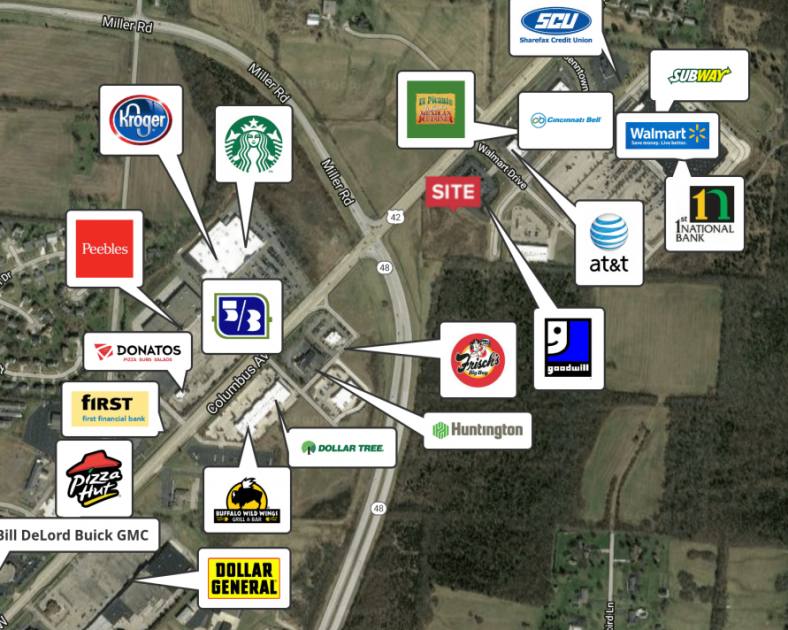
- • Corner lot - US 42 and SR 48 - In front of Walmart
- • All Utilities
- • Flexible Zoning - GC - General Commercial
- • Strong Income Demographics
- • City of Lebanon / Warren County
Additional Photos


Listing Agents

David Metz
O: 513-322-6302
M: 513-703-2204
dmetz@bergmancommercial.com
O: 513-322-6302
M: 513-703-2204
dmetz@bergmancommercial.com
While we strive to provide the most accurate information, all listing information, and demographic data, is provided by third-parties. As such, MyEListing will not be responsible for the accuracy of the information. It is strongly recommended that you verify all information with the listing agent, and any relevant agencies, prior to making any decisions.


