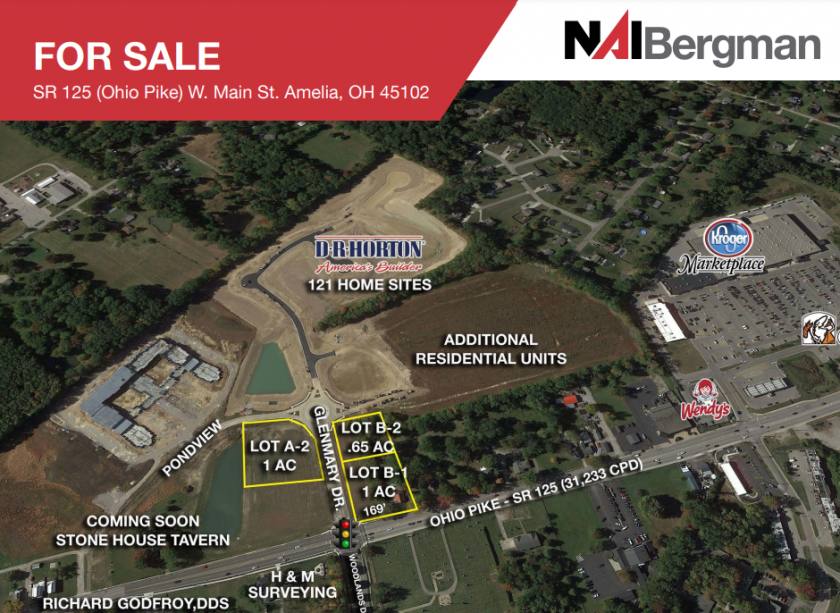
Commercial Land
SR 125 Ohio Pike W. Main St. Amelia Lot B-2 Amelia, OH 45102
SR 125 Ohio Pike W. Main St. Amelia Lot B-2 Amelia, OH 45102
Details & Description
Property Highlights
- • NEW Traffic Signal
- • All Utilities at the Property
- • Lots A-2, B-1, & B-2 Available FOR SALE
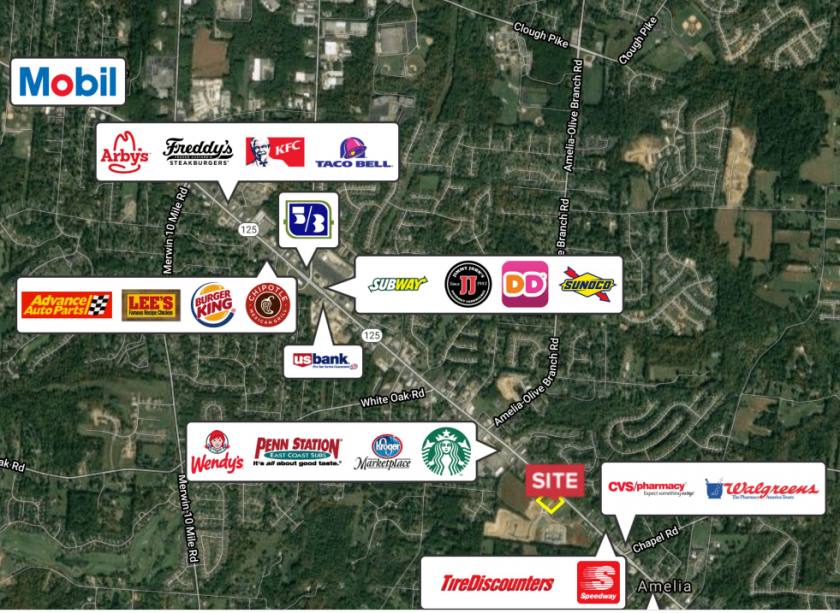
- • Neighboring retail: Kroger Marketplace
- • Traffic @ SR 125 - 28,326 CPD
- • Lot prices starting at $295,000
Listing Agents

David Metz
O: 513-322-6302
M: 513-703-2204
dmetz@bergmancommercial.com
O: 513-322-6302
M: 513-703-2204
dmetz@bergmancommercial.com
While we strive to provide the most accurate information, all listing information, and demographic data, is provided by third-parties. As such, MyEListing will not be responsible for the accuracy of the information. It is strongly recommended that you verify all information with the listing agent, and any relevant agencies, prior to making any decisions.