Commercial Land
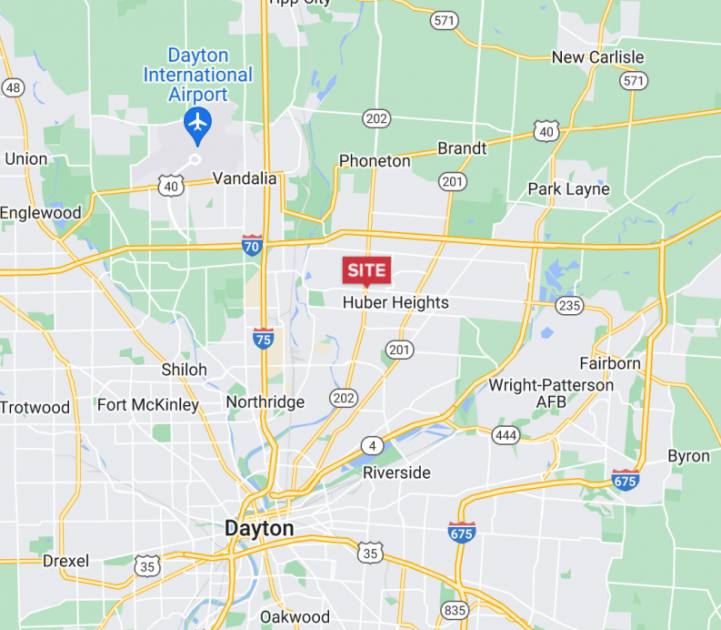
6502 Old Troy Pike Huber Heights, OH 45424
6502 Old Troy Pike Huber Heights, OH 45424
Details & Description
Property Highlights
- • Price Reduced!
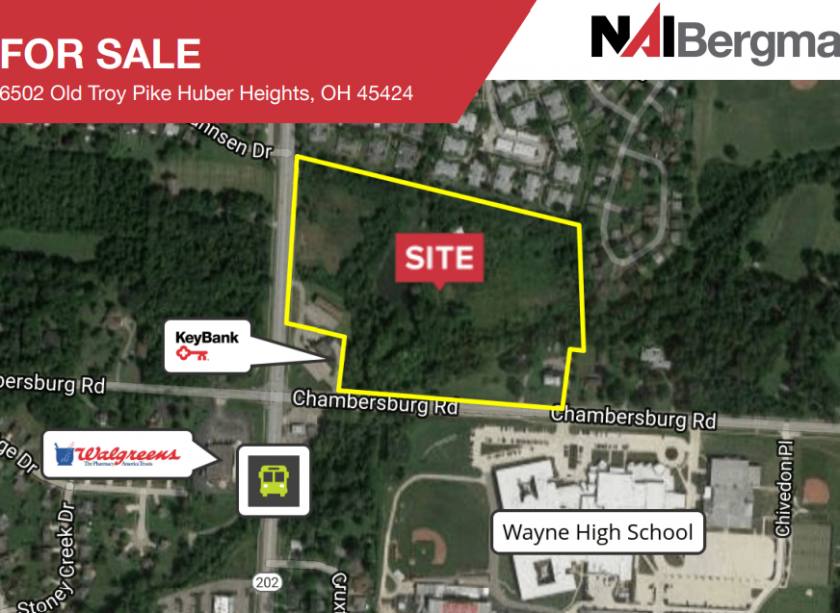
- • 20.014 acres
- • Tranquil setting in an urban environment
- • Senior housing or multi-family use possible
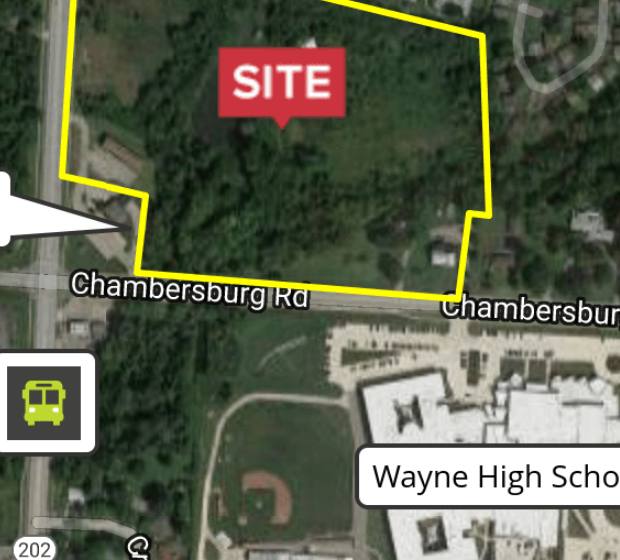
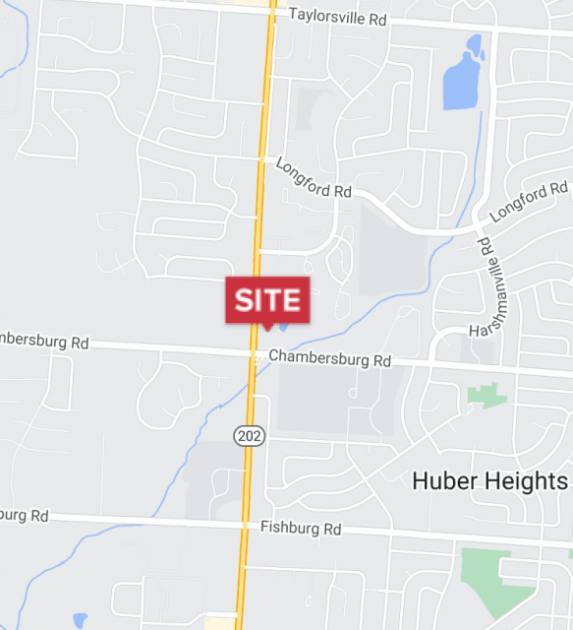
Additional Photos


Listing Agents

David Dickinson
O: 937-572-1222
M: 937-572-1222
ddickinson@bergmancommercial.com
O: 937-572-1222
M: 937-572-1222
ddickinson@bergmancommercial.com
While we strive to provide the most accurate information, all listing information, and demographic data, is provided by third-parties. As such, MyEListing will not be responsible for the accuracy of the information. It is strongly recommended that you verify all information with the listing agent, and any relevant agencies, prior to making any decisions.