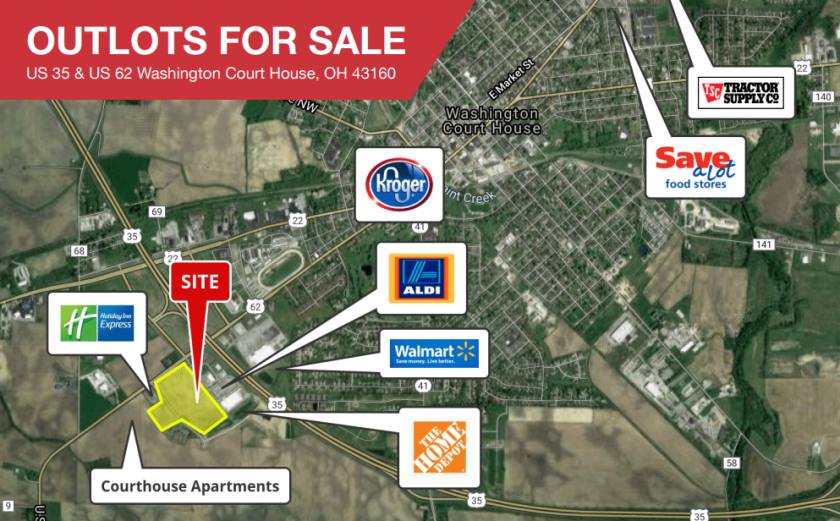
1-Mile | 3-Miles | 5-Miles | ||
---|---|---|---|---|
Total Population | 678 | 10,738 | 17,911 | |
Population Median Age | 42 | 40 | 40 | |
Population by Age | 0-9 Yrs | 46 (6%) | 1209 (11%) | 2081 (11%) |
10-19 Yrs | 81 (11%) | 1516 (14%) | 2488 (13%) | |
20-29 Yrs | 117 (17%) | 1428 (13%) | 2365 (13%) | |
30-39 Yrs | 95 (14%) | 1115 (10%) | 2083 (11%) | |
40-49 Yrs | 72 (10%) | 1428 (13%) | 2289 (12%) | |
50-59 Yrs | 97 (14%) | 1485 (13%) | 2392 (13%) | |
60-69 Yrs | 65 (9%) | 1232 (11%) | 2019 (11%) | |
70+ Yrs | 105 (15%) | 1326 (12%) | 2194 (12%) | |
Median HH Income | $55,039 | $45,264 | $45,483 | |
Total Household Income | < 24K | 48 (17%) | 1228 (27%) | 2050 (27%) |
25-49K | 84 (30%) | 1182 (26%) | 2037 (27%) | |
50-74K | 37 (13%) | 832 (18%) | 1409 (18%) | |
75-99K | 38 (13%) | 464 (10%) | 813 (10%) | |
100-199K | 60 (21%) | 678 (15%) | 1012 (13%) | |
200K+ | 8 (2%) | 77 (1%) | 134 (1%) | |
Highest Education Level | No Diploma | 113 | 1413 | 2213 |
Diploma or GED | 156 | 3197 | 5311 | |
Some College | 97 | 1234 | 2021 | |
Assoc. Degree | 9 | 466 | 823 | |
Bachelors Degree | 76 | 731 | 1237 | |
Higher Degree | 61 | 430 | 611 | |
Total Housing Units | 299 | 4,870 | 8,082 | |
--Owner-Occupied | 210 | 2,749 | 4,310 | |
--Renter-Occupied | 64 | 1,712 | 3,146 | |
Owner-Occupied Values | < 100K | 37 | 1124 | 1708 |
100-199K | 111 | 1265 | 2008 | |
200-299K | 51 | 241 | 390 | |
300-399K | 8 | 54 | 105 | |
400-499K | 0 | 11 | 28 | |
500K+ | 4 | 54 | 71 | |
Total Working Age Population | 607 | 8,571 | 14,229 | |
In Work Force | 326 | 4,902 | 8,051 | |
Not In Work Force | 282 | 3,669 | 6,178 | |
Workforce Employed | 288 | 4,625 | 7,606 | |
Workforce Unemployed | 38 | 276 | 442 | |
Civlian Workforce | 326 | 4,901 | 8,048 | |
Military Workforce | 0 | 1 | 3 | |
Total Households | 275 | 4,461 | 7,456 | |
Family Households | 177 | 2,877 | 4,852 | |
Non-Family Households | 97 | 1,584 | 2,604 | |
Married Couple | 127 | 1,867 | 3,247 | |
Other Family | 50 | 1,010 | 1,606 | |
Married w/Child | 42 | 710 | 1,230 | |
Single Male w/Child | 1 | 125 | 230 | |
Single Female w/Child | 15 | 428 | 640 |
Population Change Last Two Decades - Plus Projection
2000 | % | 2010 | % | 2020 | % | 2030 | |
---|---|---|---|---|---|---|---|
Ohio | 11,353,140 | +2 | 11,536,504 | 0 | 11,574,870 | 0 | 11,615,100 |
Fayette County | 28,433 | +2 | 29,030 | -1 | 28,860 | 0 | 28,750 |
Total Working Age Population:
Total Households:
Total Working Age Population:
Total Households:
Total Working Age Population:
Total Households: