Health Care and Medical Properties
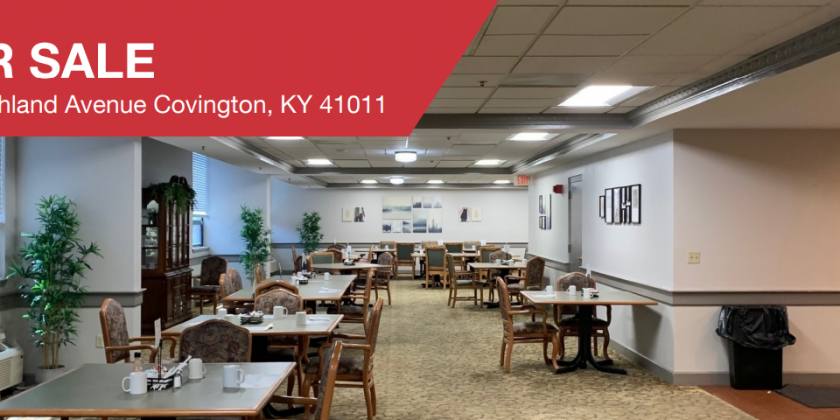
800 Highland Avenue Fort Wright, KY 41011
800 Highland Avenue Fort Wright, KY 41011

Details & Description
Property Highlights
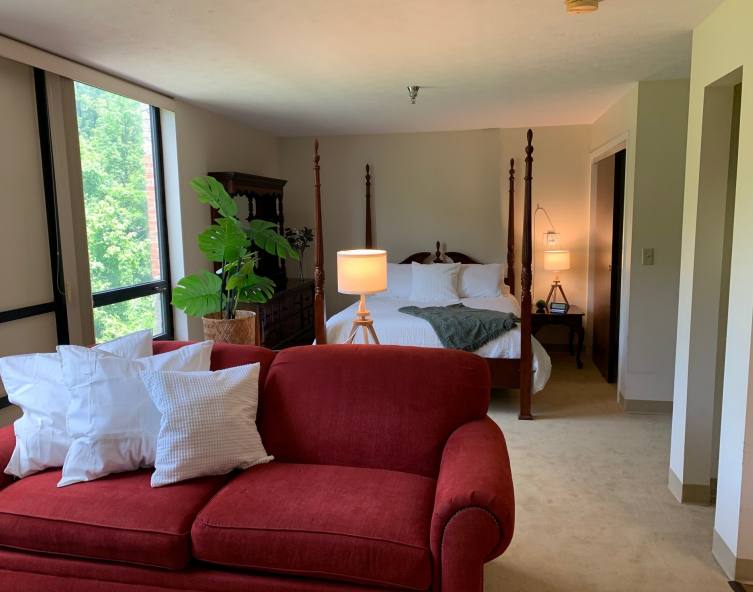
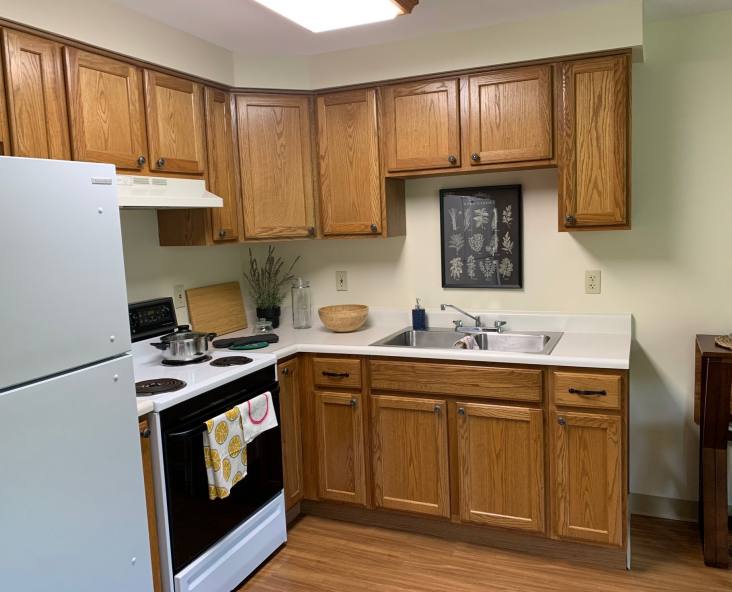
- • Ivy Knoll, Senior Community
- • 3.975 AC + 1.51 AC
- • 98 Units
- • 30 Units Fully Staffed 24/7
- • 68 Independent Living Units
- • Located Off of I-71/75
Additional Photos


Listing Agents

Billy Gillman
O: 513-322-6319
M: 513-604-4530
billy@bergmancommercial.com
O: 513-322-6319
M: 513-604-4530
billy@bergmancommercial.com

Michael Bergman
O: 513-322-6309
M: 678-595-5954
mbergman@bergmancommercial.com
O: 513-322-6309
M: 678-595-5954
mbergman@bergmancommercial.com
While we strive to provide the most accurate information, all listing information, and demographic data, is provided by third-parties. As such, MyEListing will not be responsible for the accuracy of the information. It is strongly recommended that you verify all information with the listing agent, and any relevant agencies, prior to making any decisions.