Retail Space
3025 Colerain Avenue Cincinnati, OH 45225
3025 Colerain Avenue Cincinnati, OH 45225

Details & Description
Property Highlights
- • Growing Artistic Neighborhood
- • Tremendous Visibility on Colerain Ave
- • Signage Available
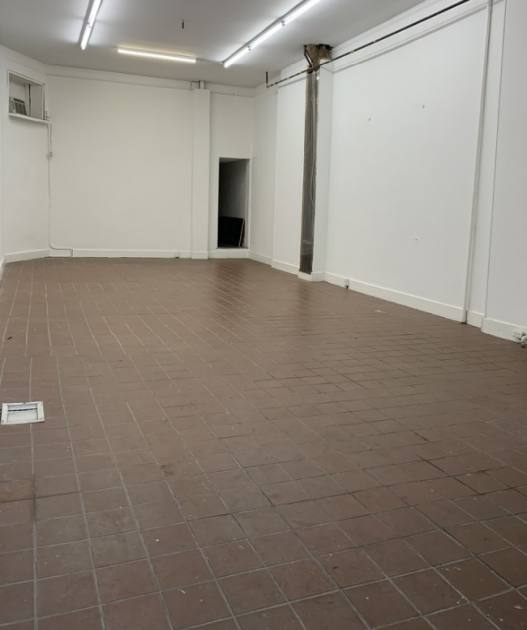
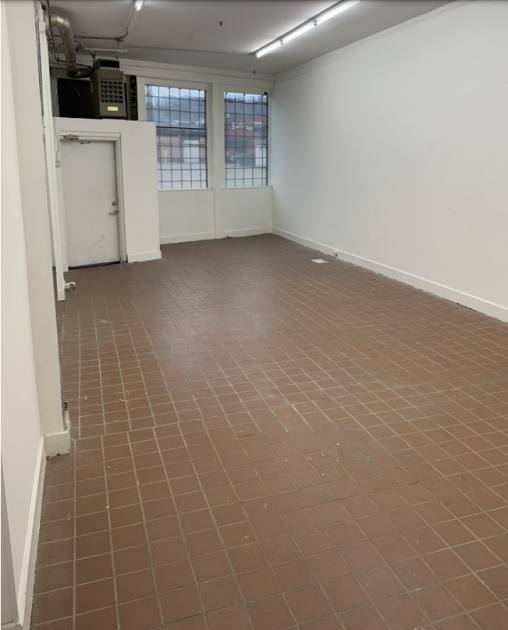
- • Open Floor Plan
- • High Ceilings
- • Easily Identifiable by Its Iconic Building Mural
Additional Photos

Listing Agents

Alex Boymel
O: 513-322-8323
M: 513-608-4932
aboymel@bergmancommercial.com
O: 513-322-8323
M: 513-608-4932
aboymel@bergmancommercial.com
While we strive to provide the most accurate information, all listing information, and demographic data, is provided by third-parties. As such, MyEListing will not be responsible for the accuracy of the information. It is strongly recommended that you verify all information with the listing agent, and any relevant agencies, prior to making any decisions.


