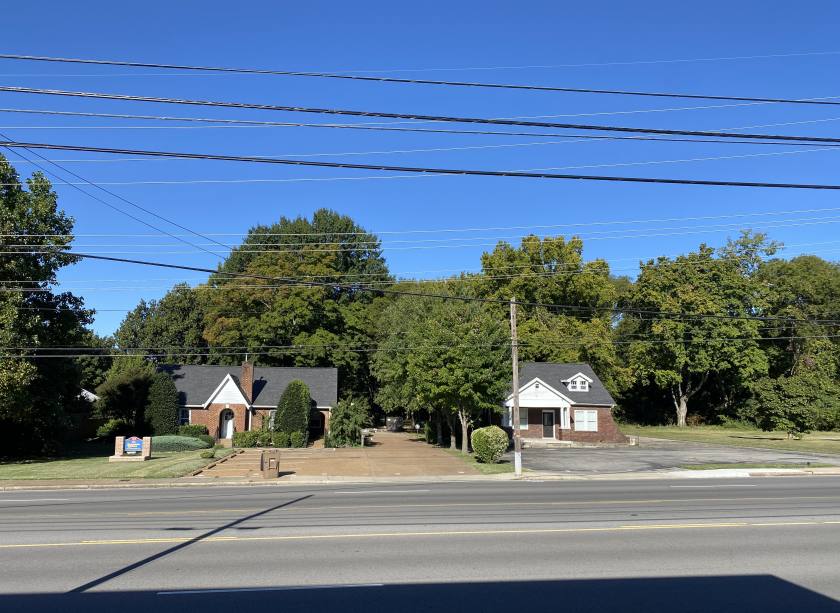
1-Mile | 3-Miles | 5-Miles | ||
---|---|---|---|---|
Total Population | 5,328 | 37,882 | 116,268 | |
Population Median Age | 41 | 37 | 37 | |
Population by Age | 0-9 Yrs | 571 (10%) | 4612 (12%) | 13691 (11%) |
10-19 Yrs | 402 (7%) | 3262 (8%) | 10666 (9%) | |
20-29 Yrs | 721 (13%) | 7101 (18%) | 21184 (18%) | |
30-39 Yrs | 1035 (19%) | 7081 (18%) | 23114 (19%) | |
40-49 Yrs | 659 (12%) | 4530 (11%) | 14569 (12%) | |
50-59 Yrs | 707 (13%) | 5145 (13%) | 14608 (12%) | |
60-69 Yrs | 529 (9%) | 3250 (8%) | 10020 (8%) | |
70+ Yrs | 703 (13%) | 2900 (7%) | 8415 (7%) | |
Median HH Income | $55,033 | $58,211 | $58,387 | |
Total Household Income | < 24K | 396 (14%) | 2422 (14%) | 7935 (15%) |
25-49K | 791 (29%) | 4481 (26%) | 13543 (26%) | |
50-74K | 688 (25%) | 4561 (26%) | 10810 (21%) | |
75-99K | 370 (13%) | 2339 (13%) | 6765 (13%) | |
100-199K | 373 (13%) | 2853 (16%) | 10241 (20%) | |
200K+ | 48 (1%) | 450 (2%) | 1862 (3%) | |
Highest Education Level | No Diploma | 321 | 2663 | 7998 |
Diploma or GED | 925 | 6931 | 19532 | |
Some College | 1117 | 5934 | 18132 | |
Assoc. Degree | 264 | 1952 | 5904 | |
Bachelors Degree | 1215 | 7620 | 23678 | |
Higher Degree | 291 | 2355 | 9283 | |
Total Housing Units | 2,786 | 18,686 | 56,477 | |
--Owner-Occupied | 1,812 | 9,019 | 27,158 | |
--Renter-Occupied | 853 | 8,087 | 23,997 | |
Owner-Occupied Values | < 100K | 66 | 652 | 1397 |
100-199K | 839 | 3560 | 8278 | |
200-299K | 575 | 3133 | 9367 | |
300-399K | 281 | 1198 | 4703 | |
400-499K | 33 | 297 | 1786 | |
500K+ | 19 | 178 | 1627 | |
Total Working Age Population | 4,558 | 31,309 | 96,305 | |
In Work Force | 2,988 | 23,352 | 71,670 | |
Not In Work Force | 1,570 | 7,957 | 24,635 | |
Workforce Employed | 2,854 | 22,430 | 68,411 | |
Workforce Unemployed | 134 | 922 | 3,196 | |
Civlian Workforce | 2,988 | 23,352 | 71,606 | |
Military Workforce | 0 | 0 | 64 | |
Total Households | 2,665 | 17,106 | 51,155 | |
Family Households | 1,237 | 8,596 | 26,099 | |
Non-Family Households | 1,428 | 8,510 | 25,056 | |
Married Couple | 912 | 6,045 | 18,019 | |
Other Family | 325 | 2,551 | 8,080 | |
Married w/Child | 289 | 2,346 | 7,146 | |
Single Male w/Child | 41 | 308 | 1,017 | |
Single Female w/Child | 147 | 1,050 | 3,169 |
Population Change Last Two Decades - Plus Projection
2000 | % | 2010 | % | 2020 | % | 2030 | |
---|---|---|---|---|---|---|---|
Tennessee | 5,689,283 | +12 | 6,346,105 | +9 | 6,886,369 | +7 | 7,393,069 |
Davidson County | 569,891 | +10 | 626,681 | +13 | 705,400 | +7 | 756,117 |
Total Working Age Population:
Total Households:
Total Working Age Population:
Total Households:
Total Working Age Population:
Total Households: